Experimental Design
Help Questions
ACT Science › Experimental Design
A lab group investigated whether a caffeine solution increases heart rate in Daphnia (water fleas). Hypothesis: higher caffeine concentration increases Daphnia heart rate. Procedure: (1) Prepare caffeine solutions at 0.0% (control), 0.1%, and 0.5% (mass/volume) in pond water. (2) Place one Daphnia in a depression slide with 1 mL of solution and allow 2 minutes to acclimate. (3) Under a microscope, count heartbeats for 15 seconds and multiply by 4 to estimate beats/min. (4) Repeat for 10 Daphnia per concentration. (5) The same student performed all counts to reduce observer variation. The group compared mean beats/min among concentrations.
A flaw in the experimental design is that:
Heartbeats were counted for 15 seconds instead of a full minute.
Using one observer eliminates bias, so additional observers were required.
Different Daphnia were used at each concentration, preventing within-subject comparisons.
Water temperature was not controlled or recorded during microscope observations.
Explanation
The experiment tests whether caffeine concentration affects Daphnia heart rate by comparing different caffeine solutions. A critical flaw is that water temperature was not controlled or recorded during microscope observations, yet temperature is known to significantly affect heart rate in ectothermic organisms like Daphnia. The microscope light could heat the slide, and different observation times could lead to different temperatures, introducing an uncontrolled variable that could mask or exaggerate caffeine effects. Using different Daphnia (B) is actually appropriate for this design, and counting for 15 seconds (A) is a reasonable time-saving measure that doesn't constitute a flaw.
A chemistry class tested whether the surface area of calcium carbonate affects reaction rate with hydrochloric acid. Hypothesis: powdered CaCO$_3$ reacts faster than a single large chunk of the same mass. Procedure: (1) Measure 2.00 g of CaCO$_3$ as either powder or one intact chip. (2) Add 50.0 mL of 1.0 M HCl to a 250 mL flask. (3) Add CaCO$_3$, immediately seal the flask with a stopper connected to a gas syringe, and start a timer. (4) Record CO$_2$ volume in the syringe every 10 s for 120 s. (5) Repeat 3 trials per CaCO$_3$ form, using fresh acid each time. The class compared CO$_2$ volume vs. time curves.
Which hypothesis is being tested?
CO$_2$ gas dissolves in HCl less when the flask is sealed with a stopper.
Higher HCl concentration produces more CO$_2$ than lower HCl concentration for the same CaCO$_3$.
Powdered CaCO$_3$ produces CO$_2$ more rapidly than a single chip of equal mass.
CaCO$_3$ powder has a greater total mass than a CaCO$_3$ chip measured on a balance.
Explanation
The experiment's stated hypothesis is that powdered CaCO₃ reacts faster than a single large chunk of the same mass, focusing on how surface area affects reaction rate. The procedure tests this by comparing CO₂ production over time between powder and chip forms of equal mass (2.00 g). The hypothesis being tested is that powdered CaCO₃ produces CO₂ more rapidly than a single chip of equal mass, as increased surface area provides more contact points for the acid reaction. The experiment does not test different HCl concentrations (A), gas solubility (C), or mass measurement accuracy (D).
In Study 1, the independent variable (the factor intentionally changed by the student) was:
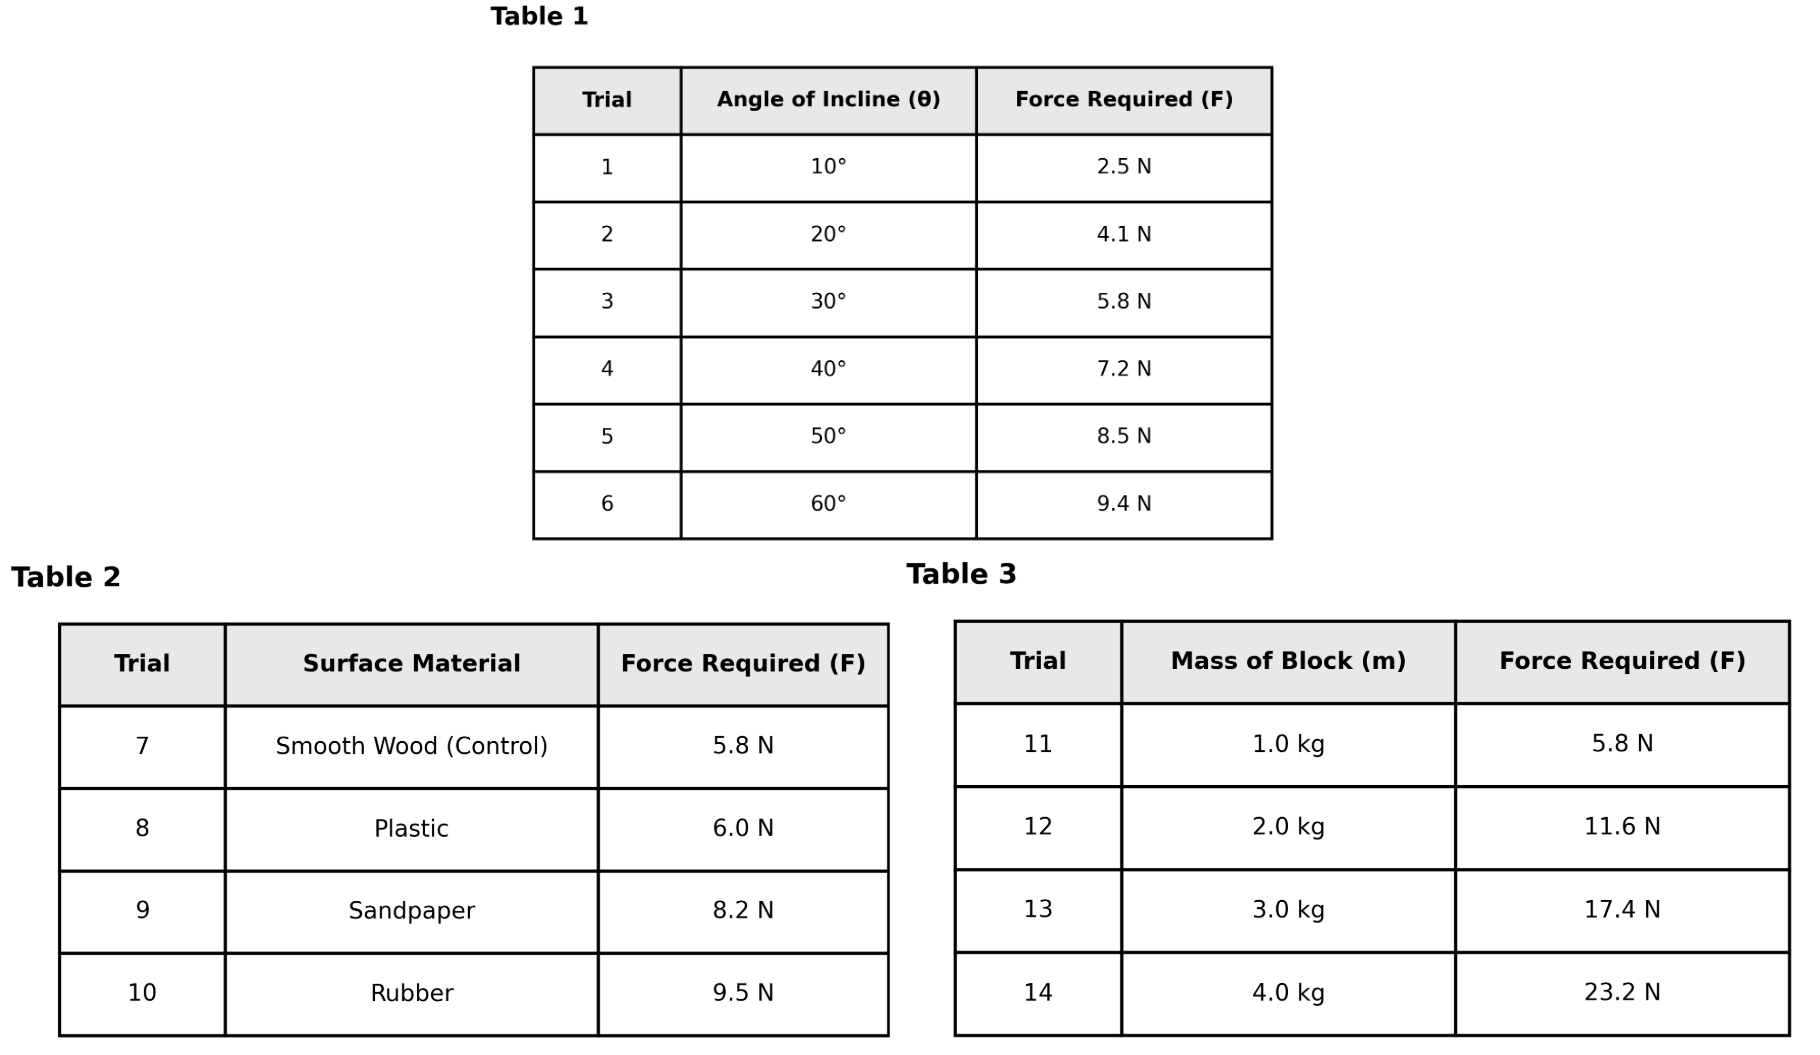
the surface material.
the mass of the block.
the force measured by the spring scale.
the angle of the incline.
Explanation
This is an experimental design question about variables. The independent variable is what the experimenter deliberately manipulates to see its effect. Study 1's procedure states: "The student varied the angle of the incline from 10° to 60°." This shows the angle was intentionally changed across trials. Choice B is correct. Choice A (mass) was kept constant at 1.0 kg in Study 1. Choice C (force) is the dependent variable being measured, not manipulated. Choice D (surface material) was kept constant (smooth wood) in Study 1. Pro tip: Independent variables are described with words like "varied," "changed," or "tested." Dependent variables are "measured" or "recorded."
In Study 3, the students included Trial 6 (0.0% NaHCO₃) primarily to:
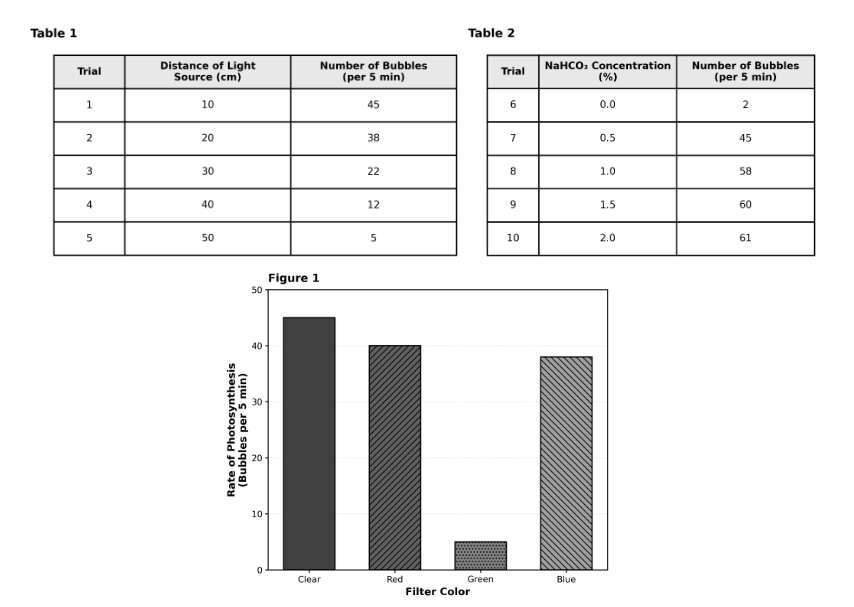
prove that Elodea can produce oxygen without carbon dioxide.
measure the amount of oxygen dissolved in the water before the experiment began.
determine the maximum possible rate of photosynthesis.
serve as a control to verify that CO₂ is necessary for photosynthesis.
Explanation
This is an experimental design question about controls. Trial 6 with 0.0% NaHCO₃ represents the absence of the carbon dioxide source. By including this negative control (no CO₂), students can verify that CO₂ is actually necessary—if bubbles still appear without CO₂, it would invalidate their assumption. The fact that only 2 bubbles appeared (compared to 45+ with CO₂) confirms CO₂ is essential. Choice B correctly identifies this control purpose. Choice A (maximum rate) would require optimal conditions, not zero CO₂. Choice C (produce without CO₂) contradicts the data (only 2 bubbles suggests minimal activity). Choice D (pre-existing oxygen) isn't the control's purpose. Pro tip: Trials with zero concentration of the independent variable are negative controls testing necessity.
In Study 1, the animals were kept "at rest." This was an important experimental control because:
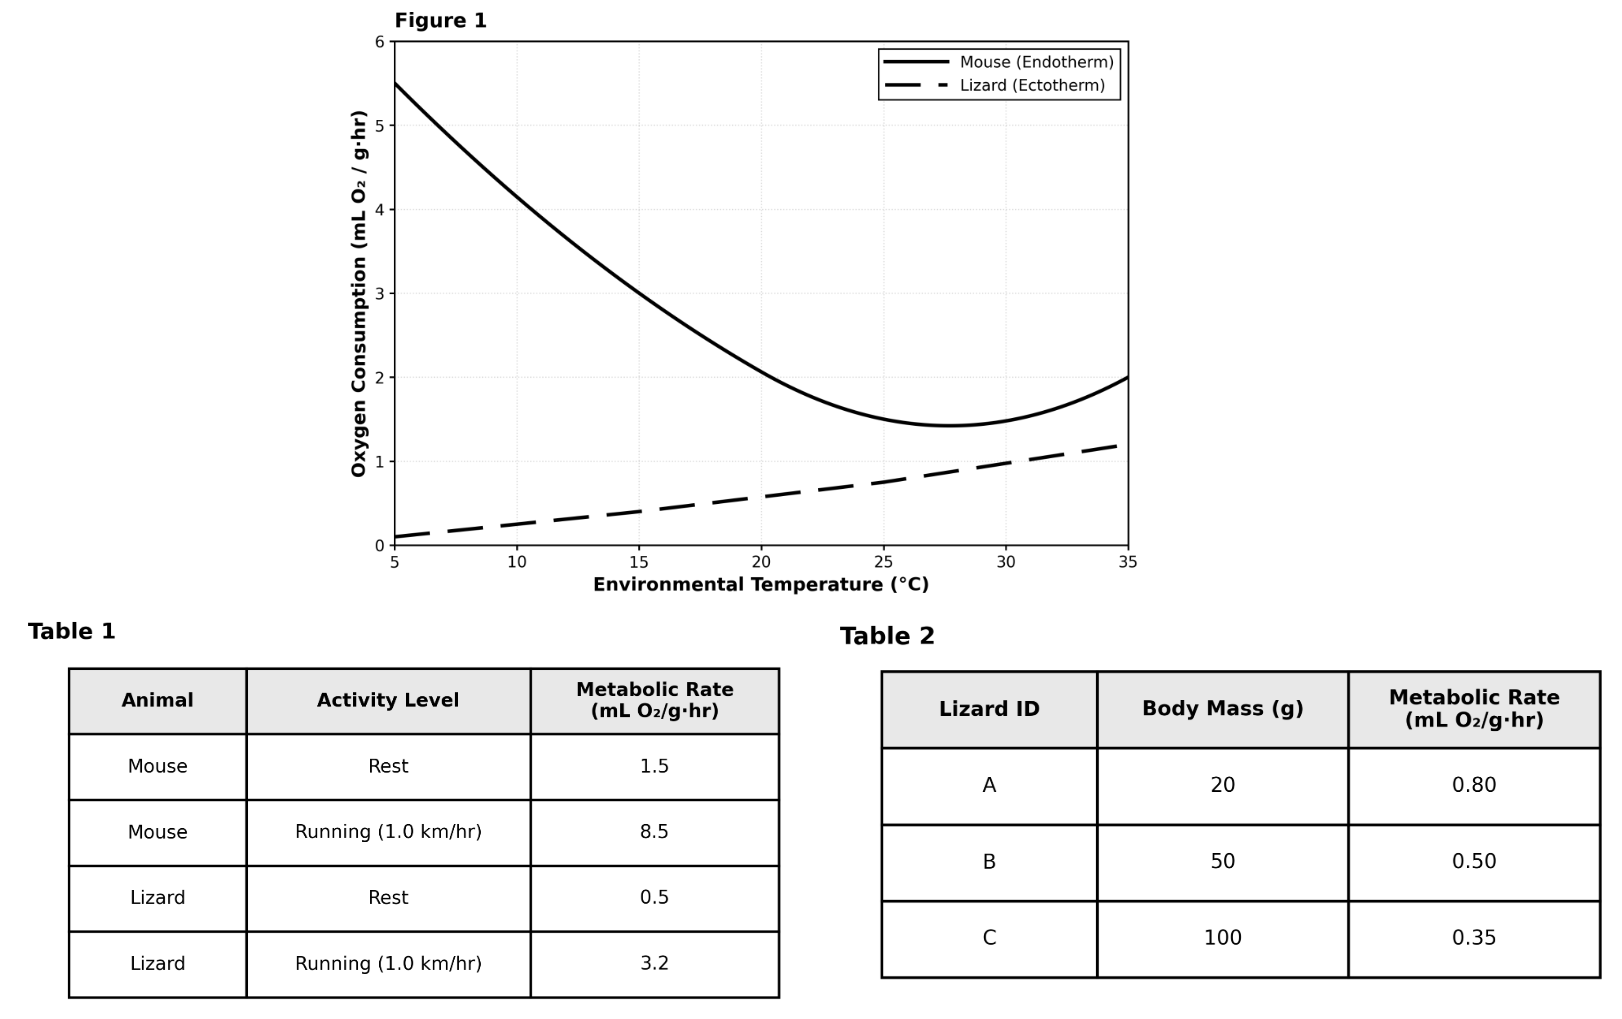
lizards cannot run at temperatures below 10°C.
activity level significantly affects metabolic rate, as shown in Study 2.
it ensured that the environmental temperature remained stable.
measuring oxygen consumption is impossible while animals are moving.
Explanation
This is an experimental design question about why a specific control was necessary. Study 1 tested the effect of temperature on metabolic rate. To isolate temperature as the only variable, activity level had to be controlled (kept constant at rest). Study 2 directly demonstrates why this control matters—it shows that running dramatically increases metabolic rate (Mouse: 1.5 → 8.5; Lizard: 0.5 → 3.2). If animals had been active in Study 1, you couldn't distinguish whether metabolic changes were due to temperature or activity. Choice B correctly identifies this control's purpose and cites the supporting evidence. Choice A is backwards—keeping animals still doesn't control temperature. Choice C is unsupported speculation. Choice D is factually wrong—measurement is possible during activity (that's what Study 2 did). Pro tip: Controls eliminate confounding variables—look for evidence elsewhere in the passage that shows why that variable needed controlling.
A student examined whether the angle of an inclined plane affects the acceleration of a rolling cart. Hypothesis: increasing ramp angle increases cart acceleration. Procedure: (1) Set a 1.00 m track on a lab bench and raise one end to create angles of 5°, 10°, and 15° (measured with a protractor). (2) Place a motion sensor at the bottom and align it with the cart’s path. (3) Release the cart from rest at the same marked starting line for each angle, without pushing. (4) Record velocity vs. time for 2.0 s and compute acceleration from the slope of the best-fit line. (5) Perform 5 trials per angle.
The experiment could be improved by:
Replacing the motion sensor with a stopwatch to avoid electronic measurement errors.
Measuring and controlling wheel friction or using the same cart and wheels throughout.
Releasing the cart from different starting positions to sample more velocities.
Using a heavier cart at higher angles to prevent it from accelerating too quickly.
Explanation
The experiment tests how ramp angle affects cart acceleration by measuring acceleration at different angles while keeping other factors constant. The experiment could be improved by measuring and controlling wheel friction or using the same cart and wheels throughout, as friction is a significant factor affecting acceleration that could vary between trials or equipment. This would ensure that observed differences in acceleration are due to angle changes rather than friction variations. Using a heavier cart (A) would change the system being studied, different starting positions (C) would violate the controlled conditions, and replacing the motion sensor (D) would likely reduce measurement precision.
A researcher tested whether adding a commercial enzyme cleaner reduces protein-based stain mass on cotton fabric. Hypothesis: fabric treated with enzyme cleaner will lose more stain mass than fabric treated with water alone. Procedure: (1) Cut 24 identical 5 cm × 5 cm cotton squares and label them. (2) Apply 0.50 mL of egg-white solution to each square and dry for 2 hours. (3) Measure and record each square’s mass using a balance (±0.001 g). (4) Randomly assign squares to 3 groups (n=8): Enzyme Cleaner, Water Only, and No Wash. (5) For Enzyme Cleaner, soak in 100 mL cleaner diluted 1:10 for 10 min with gentle stirring; for Water Only, soak in 100 mL distilled water for 10 min; for No Wash, store dry for 10 min. (6) Rinse washed groups for 30 s under running distilled water, then air-dry all squares for 12 hours. (7) Re-measure mass and compute mass change for each square.
Which hypothesis is being tested?
Enzyme cleaner causes a greater decrease in stained-fabric mass than water alone.
Rinsing under distilled water removes more stain than rinsing under tap water.
Air-drying for 12 hours removes a constant amount of water from all fabrics.
Egg-white stains increase fabric mass more on cotton than on synthetic fibers.
Explanation
The experiment's stated hypothesis is that fabric treated with enzyme cleaner will lose more stain mass than fabric treated with water alone. The procedure tests this by comparing mass changes in three groups: Enzyme Cleaner, Water Only, and No Wash control. The hypothesis being tested is that enzyme cleaner causes a greater decrease in stained-fabric mass than water alone, as this directly compares the effectiveness of the enzyme treatment versus water treatment. The other options describe different hypotheses about fabric types (A), water types (B), or drying effects (D) that are not being tested in this experiment.
A researcher tested whether activated charcoal removes dye from water. Materials: 6 clear cups, blue dye solution, activated charcoal powder, coffee filters, and a balance. Procedure: (1) Add 100 mL of the same dye solution to each cup. (2) Add charcoal to reach 0.0 g, 0.5 g, or 1.0 g (2 cups per amount). (3) Stir each cup for exactly 30 s. (4) Filter each mixture through a coffee filter into a clean cup. (5) Measure the filtered liquid’s color intensity using a phone app that reports a “blue value” from 0 (no blue) to 255 (very blue). Lower blue values indicate more dye removal.
Step 4 (filtering) was included in order to:
Remove charcoal particles so the color measurement reflects dissolved dye, not suspended black powder.
Chemically convert blue dye into a colorless form by exposing it to oxygen in the filter.
Increase dye concentration by evaporating water during filtration, making differences easier to detect.
Standardize the amount of charcoal added, because filters absorb excess charcoal to a fixed level.
Explanation
The purpose of filtering is to remove the charcoal particles from the solution before measuring color intensity. The experiment tests whether charcoal removes dye by adsorption, but the presence of black charcoal powder in the liquid would interfere with accurate color measurement. Filtering separates the solid charcoal (which may have adsorbed dye) from the liquid phase, allowing the app to measure only the dissolved dye remaining in solution. Answer A correctly identifies this purpose - removing charcoal particles so color measurement reflects dissolved dye concentration. The filter doesn't concentrate dye or chemically convert it.
A chemistry student tested whether activated charcoal removes dye from water. Materials: 6 flasks, 100 mL blue dye solution (same initial absorbance), activated charcoal, filter paper, spectrophotometer. Procedure: (1) Add 0 g, 0.5 g, or 1.0 g charcoal to flasks (2 flasks per amount). (2) Swirl for 60 s and let sit for 5 min. (3) Filter each mixture to remove charcoal particles. (4) Measure absorbance of the filtrate at the dye’s peak wavelength. Expected outcome: higher charcoal mass yields lower absorbance. Step 3 was included in order to:
Ensure the dye fully dissolves before measurement, preventing undissolved dye crystals from forming.
Remove charcoal solids that would scatter light and interfere with spectrophotometer absorbance readings.
Increase dye concentration by evaporating water so absorbance readings are easier to compare.
Allow charcoal to chemically react with the dye to form a new colored compound in solution.
Explanation
Step 3 was included to remove charcoal solids that would scatter light and interfere with spectrophotometer absorbance readings. Activated charcoal particles would cause light scattering and create turbidity that affects absorbance measurements independently of dye concentration, so filtration ensures accurate measurement of dissolved dye remaining in solution. Choice B correctly identifies this analytical purpose: removing particles prevents optical interference. Choice C incorrectly suggests chemical reaction, when charcoal physically adsorbs dye molecules.
A scientist is testing the hypothesis that a new drug reduces blood pressure. Participants are given the drug, and their blood pressure is measured before and after. A flaw in the experimental design is that:
Blood pressure is not measured frequently.
The dosage of the drug is consistent.
Participants are not randomly selected.
There is no control group.
Explanation
The hypothesis is that the new drug reduces blood pressure in participants. However, the experimental design lacks a crucial control group - participants who receive a placebo or no treatment - which is necessary to determine if observed changes are due to the drug rather than other factors like natural variation or placebo effects. Without a control group, any blood pressure changes cannot be confidently attributed to the drug's effectiveness. The absence of a control group is a fundamental flaw that prevents drawing valid conclusions about the drug's efficacy.