Graphing Differential Equations - AP Calculus AB
Card 0 of 140
Find the local maximum for the function  .
.
Find the local maximum for the function
To find the local max, you must find the first derivative, which is  .
.
Then. you need to set that equal to zero, so that you can find the critical points. The critical points are telling you where the slope is zero, and also clues you in to where the function is changing direction. When you set this derivative equal to zero and factor the function, you get (x+1)=0") , giving you two critical points at
, giving you two critical points at  and
and  .
.
Then, you set up a number line and test the regions in between those points. To the left of -1, pick a test value and plug it into the derivative. I chose -2 and got a negative value (you don't need the specific number, but rather, if it's negative or positive). In between -1 and 1, I chose 0 and got a possitive value. To the right of 1, I chose 2 and got a negative value. Then, I examine my number line to see where my function was going from positive to negative because that is what yields a maximum (think about a function going upwards and then changing direction downwards). That is happening at x=1.
To find the local max, you must find the first derivative, which is
Then. you need to set that equal to zero, so that you can find the critical points. The critical points are telling you where the slope is zero, and also clues you in to where the function is changing direction. When you set this derivative equal to zero and factor the function, you get
Then, you set up a number line and test the regions in between those points. To the left of -1, pick a test value and plug it into the derivative. I chose -2 and got a negative value (you don't need the specific number, but rather, if it's negative or positive). In between -1 and 1, I chose 0 and got a possitive value. To the right of 1, I chose 2 and got a negative value. Then, I examine my number line to see where my function was going from positive to negative because that is what yields a maximum (think about a function going upwards and then changing direction downwards). That is happening at x=1.
Compare your answer with the correct one above
Find the local maximum of the function.
=x^3-6x^2-36x+10")
Find the local maximum of the function.
When the derivative of a function is equal to zero, that means that the point is either a local maximum, local miniumum, or undefined. The derivative of  is
is  . The derivative of the given function is
=3x^2-12x-36")
We must now set it equal to zero and factor.
=0")

(x+2)=0")

Now we must plug in points to the left and right of the critical points to determine which is the local maximum.
=27")
=-36")
=27")
This means the local maximum is at  because the function is increasing at numbers less than -2 and decreasing at number between -2 and 6
When the derivative of a function is equal to zero, that means that the point is either a local maximum, local miniumum, or undefined. The derivative of
We must now set it equal to zero and factor.
Now we must plug in points to the left and right of the critical points to determine which is the local maximum.
This means the local maximum is at
Compare your answer with the correct one above
Find the local maximum of the function.
=2x^3+15x^2-36x+1")
Find the local maximum of the function.
The points where the derivative of a function are equal to 0 are called critical points. Critical points are either local maxs, local mins, or do not exist. The derivative of  is
is  . The derivative of the function is
=6x^2+30x-36")
Now we must set it equal to 0 and factor to solve.
=0")

(x-1)=0")

We must now plug in points to the left and right of the critical points into the derivative function to figure out which is the local max.
=48")
=-36")
=48")
This means that the function is increasing until it hits x=-6, then it decreases until x=1, then it begins increasing again.
This means that x=-6 is the local max.
The points where the derivative of a function are equal to 0 are called critical points. Critical points are either local maxs, local mins, or do not exist. The derivative of
Now we must set it equal to 0 and factor to solve.
We must now plug in points to the left and right of the critical points into the derivative function to figure out which is the local max.
This means that the function is increasing until it hits x=-6, then it decreases until x=1, then it begins increasing again.
This means that x=-6 is the local max.
Compare your answer with the correct one above
Find the  coordinate of the local maximum of the folowing function.
=2x^3-9x^2+12x-12")
Find the
At local maximums and minumims, the slope of the line tangent to the function is 0. To find the slope of the tangent line we must find the derivative of the function.
The derivative of  is
is  . Thus the derivative of the function is
=6x^2-18x+12")
To find maximums and minumums we set it equal to 0.


-6(x-2)")
(x-2)=0")

So the critical points are at x=1 and x=2. To figure out the maximum we must plug each into the original function.
=2(1)^3-9(1)^2+12(1)-12=-7")
=2(2)^3-9(2)^2+12(2)-12=-8")
So the local max is at x=1.
At local maximums and minumims, the slope of the line tangent to the function is 0. To find the slope of the tangent line we must find the derivative of the function.
The derivative of
To find maximums and minumums we set it equal to 0.
So the critical points are at x=1 and x=2. To figure out the maximum we must plug each into the original function.
So the local max is at x=1.
Compare your answer with the correct one above
Find the local maximum for the function .
Find the local maximum for the function
To find the local max, you must find the first derivative, which is .
Then. you need to set that equal to zero, so that you can find the critical points. The critical points are telling you where the slope is zero, and also clues you in to where the function is changing direction. When you set this derivative equal to zero and factor the function, you get , giving you two critical points at and .
Then, you set up a number line and test the regions in between those points. To the left of -1, pick a test value and plug it into the derivative. I chose -2 and got a negative value (you don't need the specific number, but rather, if it's negative or positive). In between -1 and 1, I chose 0 and got a possitive value. To the right of 1, I chose 2 and got a negative value. Then, I examine my number line to see where my function was going from positive to negative because that is what yields a maximum (think about a function going upwards and then changing direction downwards). That is happening at x=1.
To find the local max, you must find the first derivative, which is
Then. you need to set that equal to zero, so that you can find the critical points. The critical points are telling you where the slope is zero, and also clues you in to where the function is changing direction. When you set this derivative equal to zero and factor the function, you get
Then, you set up a number line and test the regions in between those points. To the left of -1, pick a test value and plug it into the derivative. I chose -2 and got a negative value (you don't need the specific number, but rather, if it's negative or positive). In between -1 and 1, I chose 0 and got a possitive value. To the right of 1, I chose 2 and got a negative value. Then, I examine my number line to see where my function was going from positive to negative because that is what yields a maximum (think about a function going upwards and then changing direction downwards). That is happening at x=1.
Compare your answer with the correct one above
Find the local maximum of the function.
Find the local maximum of the function.
When the derivative of a function is equal to zero, that means that the point is either a local maximum, local miniumum, or undefined. The derivative of is . The derivative of the given function is
We must now set it equal to zero and factor.
Now we must plug in points to the left and right of the critical points to determine which is the local maximum.
This means the local maximum is at because the function is increasing at numbers less than -2 and decreasing at number between -2 and 6
When the derivative of a function is equal to zero, that means that the point is either a local maximum, local miniumum, or undefined. The derivative of
We must now set it equal to zero and factor.
Now we must plug in points to the left and right of the critical points to determine which is the local maximum.
This means the local maximum is at
Compare your answer with the correct one above
Find the local maximum of the function.
Find the local maximum of the function.
The points where the derivative of a function are equal to 0 are called critical points. Critical points are either local maxs, local mins, or do not exist. The derivative of is . The derivative of the function is
Now we must set it equal to 0 and factor to solve.
We must now plug in points to the left and right of the critical points into the derivative function to figure out which is the local max.
This means that the function is increasing until it hits x=-6, then it decreases until x=1, then it begins increasing again.
This means that x=-6 is the local max.
The points where the derivative of a function are equal to 0 are called critical points. Critical points are either local maxs, local mins, or do not exist. The derivative of
Now we must set it equal to 0 and factor to solve.
We must now plug in points to the left and right of the critical points into the derivative function to figure out which is the local max.
This means that the function is increasing until it hits x=-6, then it decreases until x=1, then it begins increasing again.
This means that x=-6 is the local max.
Compare your answer with the correct one above
Find the coordinate of the local maximum of the folowing function.
Find the
At local maximums and minumims, the slope of the line tangent to the function is 0. To find the slope of the tangent line we must find the derivative of the function.
The derivative of is . Thus the derivative of the function is
To find maximums and minumums we set it equal to 0.
So the critical points are at x=1 and x=2. To figure out the maximum we must plug each into the original function.
So the local max is at x=1.
At local maximums and minumims, the slope of the line tangent to the function is 0. To find the slope of the tangent line we must find the derivative of the function.
The derivative of
To find maximums and minumums we set it equal to 0.
So the critical points are at x=1 and x=2. To figure out the maximum we must plug each into the original function.
So the local max is at x=1.
Compare your answer with the correct one above
The function f(x) is shown here in the graph
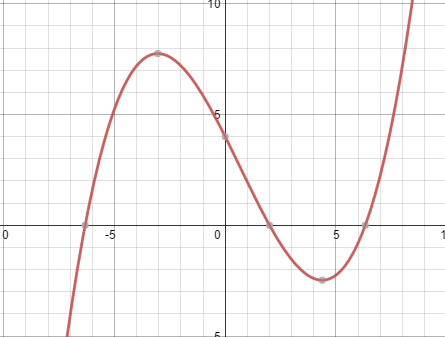
Without solving for the derivative, which of the following graphs is the graph of the derivative of ") , i.e the graph of
, i.e the graph of ") ?
?
The function f(x) is shown here in the graph
Without solving for the derivative, which of the following graphs is the graph of the derivative of
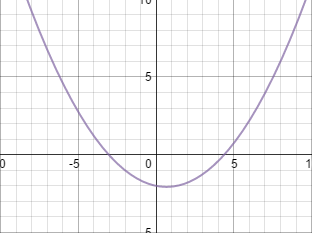
In order to determine the graph by inspection, there are key features to look for. The most important is the locations of the local maxima and minima in the graph of f(x). These points correspond to the x-intercepts in the graph of the derivative. Taking a look at the graph of f(x), you can see that the x intercepts on the graph of f'(x) will be located roughly at x = -3 and x = 4.5. Looking at the possible answers, the only two that could be graphs of f'(x) are these two:
 and
and 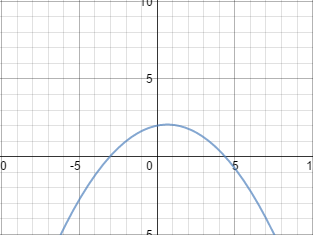
The next step would then be to see which corresponds correctly to maxima and minima. Since the point at x = -3 is a local maximum, f(x) will increase up until the point at which it is maximum, then begin to drop. As seen in the positively oriented parabola, the rate of change of f(x) (the derivative) is positive up until it reaches x = -3. This means that f(x) was increasing, and indicates that this point was a local maximum. On the other hand, if you look at the graph on the left with the negatively oriented parabola, f'(x) is negative until it reaches the local maximum, which doesn't make sense, since that would mean it was decreasing up until the point and then increasing. This indicates a minima.
Since the point at x = -3 is a local maximum, the only graph that could be the derivative of f(x) is the positively oriented parabola.
In order to determine the graph by inspection, there are key features to look for. The most important is the locations of the local maxima and minima in the graph of f(x). These points correspond to the x-intercepts in the graph of the derivative. Taking a look at the graph of f(x), you can see that the x intercepts on the graph of f'(x) will be located roughly at x = -3 and x = 4.5. Looking at the possible answers, the only two that could be graphs of f'(x) are these two:
and
The next step would then be to see which corresponds correctly to maxima and minima. Since the point at x = -3 is a local maximum, f(x) will increase up until the point at which it is maximum, then begin to drop. As seen in the positively oriented parabola, the rate of change of f(x) (the derivative) is positive up until it reaches x = -3. This means that f(x) was increasing, and indicates that this point was a local maximum. On the other hand, if you look at the graph on the left with the negatively oriented parabola, f'(x) is negative until it reaches the local maximum, which doesn't make sense, since that would mean it was decreasing up until the point and then increasing. This indicates a minima.
Since the point at x = -3 is a local maximum, the only graph that could be the derivative of f(x) is the positively oriented parabola.
Compare your answer with the correct one above
Find the local maximum for the function .
Find the local maximum for the function
To find the local max, you must find the first derivative, which is .
Then. you need to set that equal to zero, so that you can find the critical points. The critical points are telling you where the slope is zero, and also clues you in to where the function is changing direction. When you set this derivative equal to zero and factor the function, you get , giving you two critical points at and .
Then, you set up a number line and test the regions in between those points. To the left of -1, pick a test value and plug it into the derivative. I chose -2 and got a negative value (you don't need the specific number, but rather, if it's negative or positive). In between -1 and 1, I chose 0 and got a possitive value. To the right of 1, I chose 2 and got a negative value. Then, I examine my number line to see where my function was going from positive to negative because that is what yields a maximum (think about a function going upwards and then changing direction downwards). That is happening at x=1.
To find the local max, you must find the first derivative, which is
Then. you need to set that equal to zero, so that you can find the critical points. The critical points are telling you where the slope is zero, and also clues you in to where the function is changing direction. When you set this derivative equal to zero and factor the function, you get
Then, you set up a number line and test the regions in between those points. To the left of -1, pick a test value and plug it into the derivative. I chose -2 and got a negative value (you don't need the specific number, but rather, if it's negative or positive). In between -1 and 1, I chose 0 and got a possitive value. To the right of 1, I chose 2 and got a negative value. Then, I examine my number line to see where my function was going from positive to negative because that is what yields a maximum (think about a function going upwards and then changing direction downwards). That is happening at x=1.
Compare your answer with the correct one above
Find the local maximum of the function.
Find the local maximum of the function.
When the derivative of a function is equal to zero, that means that the point is either a local maximum, local miniumum, or undefined. The derivative of is . The derivative of the given function is
We must now set it equal to zero and factor.
Now we must plug in points to the left and right of the critical points to determine which is the local maximum.
This means the local maximum is at because the function is increasing at numbers less than -2 and decreasing at number between -2 and 6
When the derivative of a function is equal to zero, that means that the point is either a local maximum, local miniumum, or undefined. The derivative of
We must now set it equal to zero and factor.
Now we must plug in points to the left and right of the critical points to determine which is the local maximum.
This means the local maximum is at
Compare your answer with the correct one above
Find the local maximum of the function.
Find the local maximum of the function.
The points where the derivative of a function are equal to 0 are called critical points. Critical points are either local maxs, local mins, or do not exist. The derivative of is . The derivative of the function is
Now we must set it equal to 0 and factor to solve.
We must now plug in points to the left and right of the critical points into the derivative function to figure out which is the local max.
This means that the function is increasing until it hits x=-6, then it decreases until x=1, then it begins increasing again.
This means that x=-6 is the local max.
The points where the derivative of a function are equal to 0 are called critical points. Critical points are either local maxs, local mins, or do not exist. The derivative of
Now we must set it equal to 0 and factor to solve.
We must now plug in points to the left and right of the critical points into the derivative function to figure out which is the local max.
This means that the function is increasing until it hits x=-6, then it decreases until x=1, then it begins increasing again.
This means that x=-6 is the local max.
Compare your answer with the correct one above
Find the coordinate of the local maximum of the folowing function.
Find the
At local maximums and minumims, the slope of the line tangent to the function is 0. To find the slope of the tangent line we must find the derivative of the function.
The derivative of is . Thus the derivative of the function is
To find maximums and minumums we set it equal to 0.
So the critical points are at x=1 and x=2. To figure out the maximum we must plug each into the original function.
So the local max is at x=1.
At local maximums and minumims, the slope of the line tangent to the function is 0. To find the slope of the tangent line we must find the derivative of the function.
The derivative of
To find maximums and minumums we set it equal to 0.
So the critical points are at x=1 and x=2. To figure out the maximum we must plug each into the original function.
So the local max is at x=1.
Compare your answer with the correct one above
The function f(x) is shown here in the graph
Without solving for the derivative, which of the following graphs is the graph of the derivative of , i.e the graph of ?
The function f(x) is shown here in the graph
Without solving for the derivative, which of the following graphs is the graph of the derivative of
In order to determine the graph by inspection, there are key features to look for. The most important is the locations of the local maxima and minima in the graph of f(x). These points correspond to the x-intercepts in the graph of the derivative. Taking a look at the graph of f(x), you can see that the x intercepts on the graph of f'(x) will be located roughly at x = -3 and x = 4.5. Looking at the possible answers, the only two that could be graphs of f'(x) are these two:
and
The next step would then be to see which corresponds correctly to maxima and minima. Since the point at x = -3 is a local maximum, f(x) will increase up until the point at which it is maximum, then begin to drop. As seen in the positively oriented parabola, the rate of change of f(x) (the derivative) is positive up until it reaches x = -3. This means that f(x) was increasing, and indicates that this point was a local maximum. On the other hand, if you look at the graph on the left with the negatively oriented parabola, f'(x) is negative until it reaches the local maximum, which doesn't make sense, since that would mean it was decreasing up until the point and then increasing. This indicates a minima.
Since the point at x = -3 is a local maximum, the only graph that could be the derivative of f(x) is the positively oriented parabola.
Compare your answer with the correct one above
Find the local maximum for the function .
Find the local maximum for the function
To find the local max, you must find the first derivative, which is .
Then. you need to set that equal to zero, so that you can find the critical points. The critical points are telling you where the slope is zero, and also clues you in to where the function is changing direction. When you set this derivative equal to zero and factor the function, you get , giving you two critical points at and .
Then, you set up a number line and test the regions in between those points. To the left of -1, pick a test value and plug it into the derivative. I chose -2 and got a negative value (you don't need the specific number, but rather, if it's negative or positive). In between -1 and 1, I chose 0 and got a possitive value. To the right of 1, I chose 2 and got a negative value. Then, I examine my number line to see where my function was going from positive to negative because that is what yields a maximum (think about a function going upwards and then changing direction downwards). That is happening at x=1.
To find the local max, you must find the first derivative, which is
Then. you need to set that equal to zero, so that you can find the critical points. The critical points are telling you where the slope is zero, and also clues you in to where the function is changing direction. When you set this derivative equal to zero and factor the function, you get
Then, you set up a number line and test the regions in between those points. To the left of -1, pick a test value and plug it into the derivative. I chose -2 and got a negative value (you don't need the specific number, but rather, if it's negative or positive). In between -1 and 1, I chose 0 and got a possitive value. To the right of 1, I chose 2 and got a negative value. Then, I examine my number line to see where my function was going from positive to negative because that is what yields a maximum (think about a function going upwards and then changing direction downwards). That is happening at x=1.
Compare your answer with the correct one above