Short-run Earnings - AP Microeconomics
Card 0 of 22
Use the following graph for questions 9 - 11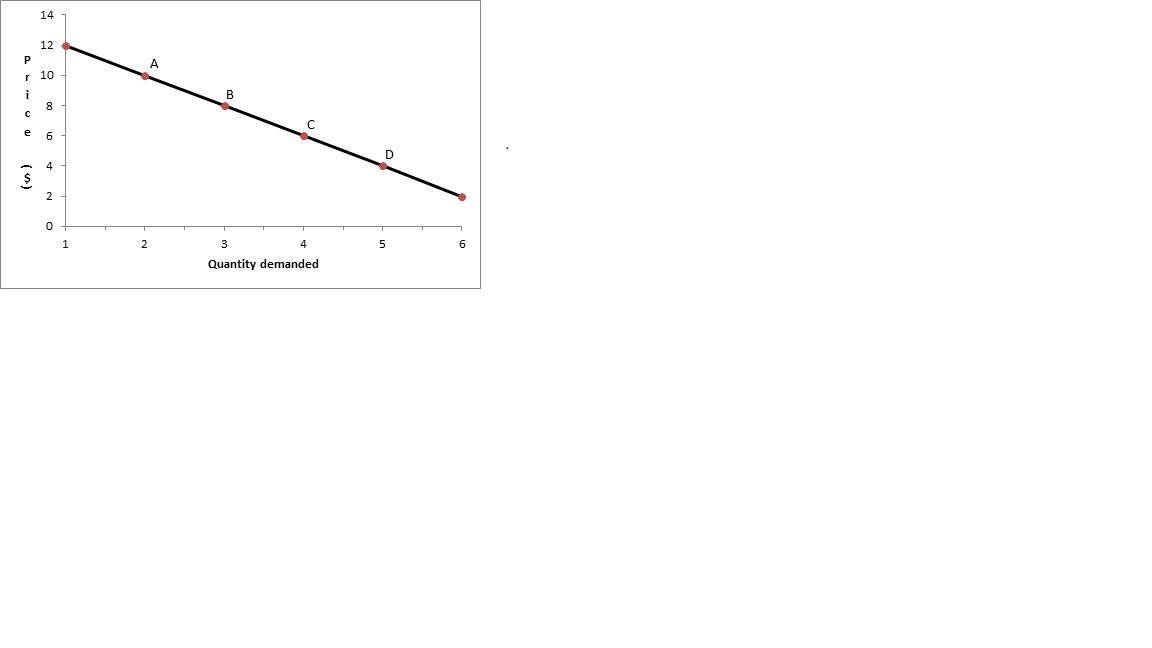
Increasing the price of oranges at point D will result in:
- An increase in total revenue
- A decrease in quantity demanded
- Movement toward a portion of the demand curve that is more elastic
Use the following graph for questions 9 - 11
Increasing the price of oranges at point D will result in:
- An increase in total revenue
- A decrease in quantity demanded
- Movement toward a portion of the demand curve that is more elastic
Tap to see back →
If we are in the inelastic portion of the demand curve, an increase in price will increase TR, since the price effect is greater than the quantity effect. Quantity will still decrease.
If we are in the inelastic portion of the demand curve, an increase in price will increase TR, since the price effect is greater than the quantity effect. Quantity will still decrease.
Use the following graph to answer questions 9-11:
What is the total revenue generated at point A?
Use the following graph to answer questions 9-11:
What is the total revenue generated at point A?
Tap to see back →
Total revenue is price multiplied by quantity (TR = P x Q). At point A, price is $10 and quantity is 2, so TR = 2 x 10 = 20.
Total revenue is price multiplied by quantity (TR = P x Q). At point A, price is $10 and quantity is 2, so TR = 2 x 10 = 20.
Use the following graph for questions 9 - 11
Increasing the price of oranges at point D will result in:
- An increase in total revenue
- A decrease in quantity demanded
- Movement toward a portion of the demand curve that is more elastic
Use the following graph for questions 9 - 11
Increasing the price of oranges at point D will result in:
- An increase in total revenue
- A decrease in quantity demanded
- Movement toward a portion of the demand curve that is more elastic
Tap to see back →
If we are in the inelastic portion of the demand curve, an increase in price will increase TR, since the price effect is greater than the quantity effect. Quantity will still decrease.
If we are in the inelastic portion of the demand curve, an increase in price will increase TR, since the price effect is greater than the quantity effect. Quantity will still decrease.
Use the following graph to answer questions 9-11:
What is the total revenue generated at point A?
Use the following graph to answer questions 9-11:
What is the total revenue generated at point A?
Tap to see back →
Total revenue is price multiplied by quantity (TR = P x Q). At point A, price is $10 and quantity is 2, so TR = 2 x 10 = 20.
Total revenue is price multiplied by quantity (TR = P x Q). At point A, price is $10 and quantity is 2, so TR = 2 x 10 = 20.
Use the following graph for questions 9 - 11
Increasing the price of oranges at point D will result in:
- An increase in total revenue
- A decrease in quantity demanded
- Movement toward a portion of the demand curve that is more elastic
Use the following graph for questions 9 - 11
Increasing the price of oranges at point D will result in:
- An increase in total revenue
- A decrease in quantity demanded
- Movement toward a portion of the demand curve that is more elastic
Tap to see back →
If we are in the inelastic portion of the demand curve, an increase in price will increase TR, since the price effect is greater than the quantity effect. Quantity will still decrease.
If we are in the inelastic portion of the demand curve, an increase in price will increase TR, since the price effect is greater than the quantity effect. Quantity will still decrease.
Use the following graph to answer questions 9-11:
What is the total revenue generated at point A?
Use the following graph to answer questions 9-11:
What is the total revenue generated at point A?
Tap to see back →
Total revenue is price multiplied by quantity (TR = P x Q). At point A, price is $10 and quantity is 2, so TR = 2 x 10 = 20.
Total revenue is price multiplied by quantity (TR = P x Q). At point A, price is $10 and quantity is 2, so TR = 2 x 10 = 20.
Use the following graph for questions 9 - 11
Increasing the price of oranges at point D will result in:
- An increase in total revenue
- A decrease in quantity demanded
- Movement toward a portion of the demand curve that is more elastic
Use the following graph for questions 9 - 11
Increasing the price of oranges at point D will result in:
- An increase in total revenue
- A decrease in quantity demanded
- Movement toward a portion of the demand curve that is more elastic
Tap to see back →
If we are in the inelastic portion of the demand curve, an increase in price will increase TR, since the price effect is greater than the quantity effect. Quantity will still decrease.
If we are in the inelastic portion of the demand curve, an increase in price will increase TR, since the price effect is greater than the quantity effect. Quantity will still decrease.
Use the following graph to answer questions 9-11:
What is the total revenue generated at point A?
Use the following graph to answer questions 9-11:
What is the total revenue generated at point A?
Tap to see back →
Total revenue is price multiplied by quantity (TR = P x Q). At point A, price is $10 and quantity is 2, so TR = 2 x 10 = 20.
Total revenue is price multiplied by quantity (TR = P x Q). At point A, price is $10 and quantity is 2, so TR = 2 x 10 = 20.
Use the following graph for questions 9 - 11
Increasing the price of oranges at point D will result in:
- An increase in total revenue
- A decrease in quantity demanded
- Movement toward a portion of the demand curve that is more elastic
Use the following graph for questions 9 - 11
Increasing the price of oranges at point D will result in:
- An increase in total revenue
- A decrease in quantity demanded
- Movement toward a portion of the demand curve that is more elastic
Tap to see back →
If we are in the inelastic portion of the demand curve, an increase in price will increase TR, since the price effect is greater than the quantity effect. Quantity will still decrease.
If we are in the inelastic portion of the demand curve, an increase in price will increase TR, since the price effect is greater than the quantity effect. Quantity will still decrease.
Use the following graph to answer questions 9-11:
What is the total revenue generated at point A?
Use the following graph to answer questions 9-11:
What is the total revenue generated at point A?
Tap to see back →
Total revenue is price multiplied by quantity (TR = P x Q). At point A, price is $10 and quantity is 2, so TR = 2 x 10 = 20.
Total revenue is price multiplied by quantity (TR = P x Q). At point A, price is $10 and quantity is 2, so TR = 2 x 10 = 20.
Use the following graph for questions 9 - 11
Increasing the price of oranges at point D will result in:
- An increase in total revenue
- A decrease in quantity demanded
- Movement toward a portion of the demand curve that is more elastic
Use the following graph for questions 9 - 11
Increasing the price of oranges at point D will result in:
- An increase in total revenue
- A decrease in quantity demanded
- Movement toward a portion of the demand curve that is more elastic
Tap to see back →
If we are in the inelastic portion of the demand curve, an increase in price will increase TR, since the price effect is greater than the quantity effect. Quantity will still decrease.
If we are in the inelastic portion of the demand curve, an increase in price will increase TR, since the price effect is greater than the quantity effect. Quantity will still decrease.
Use the following graph to answer questions 9-11:
What is the total revenue generated at point A?
Use the following graph to answer questions 9-11:
What is the total revenue generated at point A?
Tap to see back →
Total revenue is price multiplied by quantity (TR = P x Q). At point A, price is $10 and quantity is 2, so TR = 2 x 10 = 20.
Total revenue is price multiplied by quantity (TR = P x Q). At point A, price is $10 and quantity is 2, so TR = 2 x 10 = 20.
Use the following graph for questions 9 - 11
Increasing the price of oranges at point D will result in:
- An increase in total revenue
- A decrease in quantity demanded
- Movement toward a portion of the demand curve that is more elastic
Use the following graph for questions 9 - 11
Increasing the price of oranges at point D will result in:
- An increase in total revenue
- A decrease in quantity demanded
- Movement toward a portion of the demand curve that is more elastic
Tap to see back →
If we are in the inelastic portion of the demand curve, an increase in price will increase TR, since the price effect is greater than the quantity effect. Quantity will still decrease.
If we are in the inelastic portion of the demand curve, an increase in price will increase TR, since the price effect is greater than the quantity effect. Quantity will still decrease.
Use the following graph to answer questions 9-11:
What is the total revenue generated at point A?
Use the following graph to answer questions 9-11:
What is the total revenue generated at point A?
Tap to see back →
Total revenue is price multiplied by quantity (TR = P x Q). At point A, price is $10 and quantity is 2, so TR = 2 x 10 = 20.
Total revenue is price multiplied by quantity (TR = P x Q). At point A, price is $10 and quantity is 2, so TR = 2 x 10 = 20.
Use the following graph for questions 9 - 11
Increasing the price of oranges at point D will result in:
- An increase in total revenue
- A decrease in quantity demanded
- Movement toward a portion of the demand curve that is more elastic
Use the following graph for questions 9 - 11
Increasing the price of oranges at point D will result in:
- An increase in total revenue
- A decrease in quantity demanded
- Movement toward a portion of the demand curve that is more elastic
Tap to see back →
If we are in the inelastic portion of the demand curve, an increase in price will increase TR, since the price effect is greater than the quantity effect. Quantity will still decrease.
If we are in the inelastic portion of the demand curve, an increase in price will increase TR, since the price effect is greater than the quantity effect. Quantity will still decrease.
Use the following graph to answer questions 9-11:
What is the total revenue generated at point A?
Use the following graph to answer questions 9-11:
What is the total revenue generated at point A?
Tap to see back →
Total revenue is price multiplied by quantity (TR = P x Q). At point A, price is $10 and quantity is 2, so TR = 2 x 10 = 20.
Total revenue is price multiplied by quantity (TR = P x Q). At point A, price is $10 and quantity is 2, so TR = 2 x 10 = 20.
Use the following graph for questions 9 - 11
Increasing the price of oranges at point D will result in:
- An increase in total revenue
- A decrease in quantity demanded
- Movement toward a portion of the demand curve that is more elastic
Use the following graph for questions 9 - 11
Increasing the price of oranges at point D will result in:
- An increase in total revenue
- A decrease in quantity demanded
- Movement toward a portion of the demand curve that is more elastic
Tap to see back →
If we are in the inelastic portion of the demand curve, an increase in price will increase TR, since the price effect is greater than the quantity effect. Quantity will still decrease.
If we are in the inelastic portion of the demand curve, an increase in price will increase TR, since the price effect is greater than the quantity effect. Quantity will still decrease.
Use the following graph to answer questions 9-11:
What is the total revenue generated at point A?
Use the following graph to answer questions 9-11:
What is the total revenue generated at point A?
Tap to see back →
Total revenue is price multiplied by quantity (TR = P x Q). At point A, price is $10 and quantity is 2, so TR = 2 x 10 = 20.
Total revenue is price multiplied by quantity (TR = P x Q). At point A, price is $10 and quantity is 2, so TR = 2 x 10 = 20.
Use the following graph for questions 9 - 11
Increasing the price of oranges at point D will result in:
- An increase in total revenue
- A decrease in quantity demanded
- Movement toward a portion of the demand curve that is more elastic
Use the following graph for questions 9 - 11
Increasing the price of oranges at point D will result in:
- An increase in total revenue
- A decrease in quantity demanded
- Movement toward a portion of the demand curve that is more elastic
Tap to see back →
If we are in the inelastic portion of the demand curve, an increase in price will increase TR, since the price effect is greater than the quantity effect. Quantity will still decrease.
If we are in the inelastic portion of the demand curve, an increase in price will increase TR, since the price effect is greater than the quantity effect. Quantity will still decrease.
Use the following graph to answer questions 9-11:
What is the total revenue generated at point A?
Use the following graph to answer questions 9-11:
What is the total revenue generated at point A?
Tap to see back →
Total revenue is price multiplied by quantity (TR = P x Q). At point A, price is $10 and quantity is 2, so TR = 2 x 10 = 20.
Total revenue is price multiplied by quantity (TR = P x Q). At point A, price is $10 and quantity is 2, so TR = 2 x 10 = 20.