Bivariate Data - AP Statistics
Card 0 of 76
Which of the following correlation coefficients indicates the strongest relationship between variables?
Which of the following correlation coefficients indicates the strongest relationship between variables?
Tap to see back →
Correlation coefficients range from 1 to -1. The closer to either extreme, the stronger the relationship. The closer to 0, the weaker the relationship.
Correlation coefficients range from 1 to -1. The closer to either extreme, the stronger the relationship. The closer to 0, the weaker the relationship.
In a regression analysis, the y-variable should be the variable, and the x-variable should be the variable.
In a regression analysis, the y-variable should be the variable, and the x-variable should be the variable.
Tap to see back →
Regression tests seek to determine one variable's ability to predict another variable. In this analysis, one variable is dependent (the one predicted), and the other is independent (the variable that predicts). Therefore, the dependent variable is the y-variable and the independent variable is the x-variable.
Regression tests seek to determine one variable's ability to predict another variable. In this analysis, one variable is dependent (the one predicted), and the other is independent (the variable that predicts). Therefore, the dependent variable is the y-variable and the independent variable is the x-variable.
On a residual plot, the  -axis displays the and the
  -axis displays .
On a residual plot, the
Tap to see back →
A residual plot shows the difference between the actual and expected value, or residual. This goes on the y-axis. The plot shows these residuals in relation to the independent variable.
A residual plot shows the difference between the actual and expected value, or residual. This goes on the y-axis. The plot shows these residuals in relation to the independent variable.
Tap to see back →
No explanation available
No explanation available
What transformation should be done to the data set, with its residual shown below, to linearize the data?
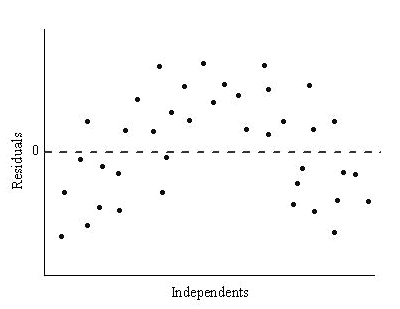
What transformation should be done to the data set, with its residual shown below, to linearize the data?
Tap to see back →
Taking the log of a data set whose residual is nonrandom is effective in increasing the correleation coefficient and results in a more linear relationship.
Taking the log of a data set whose residual is nonrandom is effective in increasing the correleation coefficient and results in a more linear relationship.
A national study on cell phone use found the following correlations:
-The correlation between the number of texts sent each day and a person's average credit card debt is  .
.
-The correlation between the number of texts sent each day and the number of books read each month is  .
.
Which of the following statements are true?
i. As the number of texts sent each day increases, average credit card debt increases.
ii. Sending more texts causes people to read less.
iii. A person's average credit card debt is related more strongly to the number of texts sent each day than the number of books read each month is related to the number of texts sent each day.
A national study on cell phone use found the following correlations:
-The correlation between the number of texts sent each day and a person's average credit card debt is
-The correlation between the number of texts sent each day and the number of books read each month is
Which of the following statements are true?
i. As the number of texts sent each day increases, average credit card debt increases.
ii. Sending more texts causes people to read less.
iii. A person's average credit card debt is related more strongly to the number of texts sent each day than the number of books read each month is related to the number of texts sent each day.
Tap to see back →
i is correct because there is a positive correlation between the number of texts sent each day and average credit card debt.
ii is incorrect because the word "cause" was used in the statement. Correlation does not mean causation. There is a relationship between the number of texts sent each day and the number of books that a person reads each month. However, the number of texts sent each day does not cause a person to read a certain number of books each month.
iii is correct because the absolute values of the correlations indicate which correlation is stronger.  is a stronger correlation than
  .
.
i is correct because there is a positive correlation between the number of texts sent each day and average credit card debt.
ii is incorrect because the word "cause" was used in the statement. Correlation does not mean causation. There is a relationship between the number of texts sent each day and the number of books that a person reads each month. However, the number of texts sent each day does not cause a person to read a certain number of books each month.
iii is correct because the absolute values of the correlations indicate which correlation is stronger.
Which of the following shows the least correlation between two variables?
Which of the following shows the least correlation between two variables?
Tap to see back →
The strength of correlation is measured on an absolute value scale of  to
to  with
with  being the least correlated and
  being the most correlated. The positive or negative in front of the correlation integer simply determines whether or not there is a positive or negative correlation between the variables.
A correlation of  means that there is no correlation at all between two variables.
The strength of correlation is measured on an absolute value scale of
A correlation of
In a medical school, it is found that there is a correlation of  between the amount of coffee consumed by students and the number of hours students sleep each night. Which of the following is true?
i. There is a positive association between the two variables.
ii. There is a strong correlation between the two variables.
iii. Coffee consumption in medical school students causes students to sleep less each night.
In a medical school, it is found that there is a correlation of
i. There is a positive association between the two variables.
ii. There is a strong correlation between the two variables.
iii. Coffee consumption in medical school students causes students to sleep less each night.
Tap to see back →
Since the correlation is negative, there must be a negative association between the two variables (therefore statement i is incorrect). Statement ii is correct since a correlation of  to
to  on an absolute value scale of
  to
to  is considered to be a strong correlation. Statement iii is incorrect since correlation does not mean causation.
Since the correlation is negative, there must be a negative association between the two variables (therefore statement i is incorrect). Statement ii is correct since a correlation of
It is found that there is a correlation of exactly  between two variables. Which of the following is incorrect?
It is found that there is a correlation of exactly
Tap to see back →
Under no circumstance will correlation ever equate to causation, regardless of how strong the correlation between two variables is. In this case, all other answer choices are correct.
Under no circumstance will correlation ever equate to causation, regardless of how strong the correlation between two variables is. In this case, all other answer choices are correct.
Which of the following correlation coefficients implies the strongest relationship between variables:


Which of the following correlation coefficients implies the strongest relationship between variables:
Tap to see back →
A high correlation coefficient regardless of sign implies a stronger relationship. In this case  has a stronger negative relationship than the positive relationship described by a value of
A high correlation coefficient regardless of sign implies a stronger relationship. In this case
A basketball coach wants to determine if a player's height can predict the number of points the player scores in a season. Which statistical test should the coach conduct?
A basketball coach wants to determine if a player's height can predict the number of points the player scores in a season. Which statistical test should the coach conduct?
Tap to see back →
Linear regression is the best option for determining whether the value of one variable predicts the value of a second variable. Since that is exactly what the coach is trying to do, he should use linear regression.
Linear regression is the best option for determining whether the value of one variable predicts the value of a second variable. Since that is exactly what the coach is trying to do, he should use linear regression.
Use the following five number summary to determine if there are any outliers in the data set:
Minimum: 
Q1: 
Median: 
Q3: 
Maximum: 
Use the following five number summary to determine if there are any outliers in the data set:
Minimum:
Q1:
Median:
Q3:
Maximum:
Tap to see back →
An observation is an outlier if it falls more than ") above the upper quartile or more than
above the upper quartile or more than ") below the lower quartile.
below the lower quartile.

= 11..5(6)= 9")
 . The minimum value is
  so there are no outliers in the low end of the distribution.
 . The maximum value is
  so there are no outliers in the high end of the distribution.
An observation is an outlier if it falls more than
For a data set, the first quartile is  , the third quartile is
  and the median is
  .
.
Based on this information, a new observation can be considered an outlier if it is greater than what?
For a data set, the first quartile is
Based on this information, a new observation can be considered an outlier if it is greater than what?
Tap to see back →
Use the  criteria:
This states that anything less than  or greater than
  will be an outlier.
Thus, we want to find
 where
where  .
.
 =1.5\cdot 30=45")
 = 70 + 45 = 115")
Therefore, any new observation greater than 115 can be considered an outlier.
Use the
This states that anything less than
Thus, we want to find
Therefore, any new observation greater than 115 can be considered an outlier.

Which values in the above data set are outliers?
Which values in the above data set are outliers?
Tap to see back →
Step 1: Recall the definition of an outlier as any value in a data set that is greater than  or less than
  .
.
Step 2: Calculate the IQR, which is the third quartile minus the first quartile, or  . To find
  and
and  , first write the data in ascending order.
 . Then, find the median, which is
  . Next, Find the median of data below
  , which is
  . Do the same for the data above
  to get
  . By finding the medians of the lower and upper halves of the data, you are able to find the value,
  that is greater than 25% of the data and
  , the value greater than 75% of the data.
Step 3:  . No values less than 64.
 . In the data set, 105 > 104, so it is an outlier.
Step 1: Recall the definition of an outlier as any value in a data set that is greater than
Step 2: Calculate the IQR, which is the third quartile minus the first quartile, or
Step 3:
You are given the following information regarding a particular data set:
Q1: 
Q3: 
Assume that the numbers  and
and  are in the data set. How many of these numbers are outliers?
You are given the following information regarding a particular data set:
Q1:
Q3:
Assume that the numbers
Tap to see back →
In order to find the outliers, we can use the  and
and  formulas.


Only two numbers are outside of the calculated range and therefore are outliers:  and
and  .
.
In order to find the outliers, we can use the
Only two numbers are outside of the calculated range and therefore are outliers:
Use the following five number summary to answer the question below:
Min: 
Q1: 
Med: 
Q3: 
Max: 
Which of the following is true regarding outliers?
Use the following five number summary to answer the question below:
Min:
Q1:
Med:
Q3:
Max:
Which of the following is true regarding outliers?
Tap to see back →
Using the  and
and  formulas, we can determine that both the minimum and maximum values of the data set are outliers.


This allows us to determine that there is at least one outlier in the upper side of the data set and at least one outlier in the lower side of the data set. Without any more information, we are not able to determine the exact number of outliers in the entire data set.
Using the
This allows us to determine that there is at least one outlier in the upper side of the data set and at least one outlier in the lower side of the data set. Without any more information, we are not able to determine the exact number of outliers in the entire data set.
A certain distribution has a 1st quartile of 8 and a 3rd quartile of 16. Which of the following data points would be considered an outlier?
A certain distribution has a 1st quartile of 8 and a 3rd quartile of 16. Which of the following data points would be considered an outlier?
Tap to see back →
An outlier is any data point that falls  above the 3rd quartile and below the first quartile. The inter-quartile range is
  and
and  . The lower bound would be
  and the upper bound would be
  . The only possible answer outside of this range is
  .
.
An outlier is any data point that falls
If a data set has a perfect negative linear correlation, has a slope of  and an explanatory variable standard deviation of
  , what is the standard deviation of the response variable?
If a data set has a perfect negative linear correlation, has a slope of
Tap to see back →
The key here is to utilize
 .
.
"Perfect negative linear correlation" means  , while the rest of the problem indicates
  and
and  . This enables us to solve for
  .
.


The key here is to utilize
"Perfect negative linear correlation" means
A least-squares regression line has equation  and a correlation of
  . It is also known that
  . What is
A least-squares regression line has equation

Tap to see back →
Use the formula  .
.
Plug in the given values for  and
and  and this becomes an algebra problem.


Use the formula
Plug in the given values for
Which of the following correlation coefficients indicates the strongest relationship between variables?
Which of the following correlation coefficients indicates the strongest relationship between variables?
Tap to see back →
Correlation coefficients range from 1 to -1. The closer to either extreme, the stronger the relationship. The closer to 0, the weaker the relationship.
Correlation coefficients range from 1 to -1. The closer to either extreme, the stronger the relationship. The closer to 0, the weaker the relationship.