How to find confidence intervals for a mean - AP Statistics
Card 0 of 24
Suppose you have a normally distributed variable with known variance. How many standard errors do you need to add and subtract from the sample mean so that you obtain 95% confidence intervals?
Suppose you have a normally distributed variable with known variance. How many standard errors do you need to add and subtract from the sample mean so that you obtain 95% confidence intervals?
Tap to see back →
To obtain 95% confidence intervals for a normal distribution with known variance, you take the mean and add/subtract  . This is because 95% of the values drawn from a normally distributed sampling distribution lie within 1.96 standard errors from the sample mean.
To obtain 95% confidence intervals for a normal distribution with known variance, you take the mean and add/subtract
An automotive engineer wants to estimate the cost of repairing a car that experiences a 25 MPH head-on collision. He crashes 24 cars, and the average repair is $11,000. The standard deviation of the 24-car sample is $2,500.
Provide a 98% confidence interval for the true mean cost of repair.
An automotive engineer wants to estimate the cost of repairing a car that experiences a 25 MPH head-on collision. He crashes 24 cars, and the average repair is $11,000. The standard deviation of the 24-car sample is $2,500.
Provide a 98% confidence interval for the true mean cost of repair.
Tap to see back →
Standard deviation for the samle mean:

Since n < 30, we must use the t-table (not the z-table).
The 98% t-value for n=24 is 2.5.

Standard deviation for the samle mean:
Since n < 30, we must use the t-table (not the z-table).
The 98% t-value for n=24 is 2.5.
The population standard deviation is 7. Our sample size is 36.
What is the 95% margin of error for:
-
the population mean
-
the sample mean
The population standard deviation is 7. Our sample size is 36.
What is the 95% margin of error for:
-
the population mean
-
the sample mean
Tap to see back →
For 95% confidence, Z = 1.96.
- The population M.O.E. =

- The sample standard deviation =

The sample M.O.E. =

For 95% confidence, Z = 1.96.
- The population M.O.E. =
- The sample standard deviation =
The sample M.O.E. =
300 hundred eggs were randomly chosen from a gravid female salmon and individually weighed. The mean weight was 0.978 g with a standard deviation of 0.042. Find the 95% confidence interval for the mean weight of the salmon eggs (because it is a large n, use the standard normal distribution).
300 hundred eggs were randomly chosen from a gravid female salmon and individually weighed. The mean weight was 0.978 g with a standard deviation of 0.042. Find the 95% confidence interval for the mean weight of the salmon eggs (because it is a large n, use the standard normal distribution).
Tap to see back →
Because we have such a large sample size, we are using the standard normal or z-distribution to calculate the confidence interval.
Formula:


We must find the appropriate z-value based on the given  for 95% confidence:
= 0.975")
Then, find the associated z-score using the z-table for

Now we fill in the formula with our values from the problem to find the 95% CI.
= (0.973 g, 0.9827 g)")
Because we have such a large sample size, we are using the standard normal or z-distribution to calculate the confidence interval.
Formula:
We must find the appropriate z-value based on the given
Then, find the associated z-score using the z-table for
Now we fill in the formula with our values from the problem to find the 95% CI.
A sample of  observations of 02 consumption by adult western fence lizards gave the following statistics:


Find the  confidence limit for the mean 02 consumption by adult western fence lizards.
A sample of
Find the
Tap to see back →
Because we are only given the sample standard deviation we will use the t-distribution to calculate the confidence interval.
Appropriate Formula:

Now we must identify our variables:


We must find the appropriate t-value based on the given
t-value at 90% confidence:
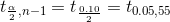
Look up t-value for 0.05, 55 , so t-value= ~ 1.6735
90% CI becomes:
")
")
Because we are only given the sample standard deviation we will use the t-distribution to calculate the confidence interval.
Appropriate Formula:
Now we must identify our variables:
We must find the appropriate t-value based on the given
t-value at 90% confidence:
Look up t-value for 0.05, 55 , so t-value= ~ 1.6735
90% CI becomes:
Subject Horn Length (in) Subject Horn Length (in) 1 19.1 11 11.6 2 14.7 12 18.5 3 10.2 13 28.7 4 16.1 14 15.3 5 13.9 15 13.5 6 12.0 16 7.7 7 20.7 17 17.2 8 8.6 18 19.0 9 24.2 19 20.9 10 17.3 20 21.3
The data above represents measurements of the horn lengths of African water buffalo that were raised on calcium supplements. Construct a 95% confidence interval for the population mean for horn length after supplments.
| Subject | Horn Length (in) | Subject | Horn Length (in) |
|---|---|---|---|
| 1 | 19.1 | 11 | 11.6 |
| 2 | 14.7 | 12 | 18.5 |
| 3 | 10.2 | 13 | 28.7 |
| 4 | 16.1 | 14 | 15.3 |
| 5 | 13.9 | 15 | 13.5 |
| 6 | 12.0 | 16 | 7.7 |
| 7 | 20.7 | 17 | 17.2 |
| 8 | 8.6 | 18 | 19.0 |
| 9 | 24.2 | 19 | 20.9 |
| 10 | 17.3 | 20 | 21.3 |
The data above represents measurements of the horn lengths of African water buffalo that were raised on calcium supplements. Construct a 95% confidence interval for the population mean for horn length after supplments.
Tap to see back →
First you must calculate the sample mean and sample standard deviation of the sample.


Because we do not know the population standard deviation we will use the t-distribution to calculate the confidence intervals. We must use standard error in this formula because we are working with the standard deviation of the sampling distribution.
Formula:

To find the appropriate t-value for 95% confidence interval:


Look up  in t-table and the corresponding t-value = 2.093.
Thus the 95% confidence interval is:
= (13.99 mm Hg, 19.07 mm Hg)")
First you must calculate the sample mean and sample standard deviation of the sample.
Because we do not know the population standard deviation we will use the t-distribution to calculate the confidence intervals. We must use standard error in this formula because we are working with the standard deviation of the sampling distribution.
Formula:
To find the appropriate t-value for 95% confidence interval:
Look up
Thus the 95% confidence interval is:
Suppose you have a normally distributed variable with known variance. How many standard errors do you need to add and subtract from the sample mean so that you obtain 95% confidence intervals?
Suppose you have a normally distributed variable with known variance. How many standard errors do you need to add and subtract from the sample mean so that you obtain 95% confidence intervals?
Tap to see back →
To obtain 95% confidence intervals for a normal distribution with known variance, you take the mean and add/subtract . This is because 95% of the values drawn from a normally distributed sampling distribution lie within 1.96 standard errors from the sample mean.
To obtain 95% confidence intervals for a normal distribution with known variance, you take the mean and add/subtract
An automotive engineer wants to estimate the cost of repairing a car that experiences a 25 MPH head-on collision. He crashes 24 cars, and the average repair is $11,000. The standard deviation of the 24-car sample is $2,500.
Provide a 98% confidence interval for the true mean cost of repair.
An automotive engineer wants to estimate the cost of repairing a car that experiences a 25 MPH head-on collision. He crashes 24 cars, and the average repair is $11,000. The standard deviation of the 24-car sample is $2,500.
Provide a 98% confidence interval for the true mean cost of repair.
Tap to see back →
Standard deviation for the samle mean:
Since n < 30, we must use the t-table (not the z-table).
The 98% t-value for n=24 is 2.5.
Standard deviation for the samle mean:
Since n < 30, we must use the t-table (not the z-table).
The 98% t-value for n=24 is 2.5.
The population standard deviation is 7. Our sample size is 36.
What is the 95% margin of error for:
-
the population mean
-
the sample mean
The population standard deviation is 7. Our sample size is 36.
What is the 95% margin of error for:
-
the population mean
-
the sample mean
Tap to see back →
For 95% confidence, Z = 1.96.
- The population M.O.E. =
- The sample standard deviation =
The sample M.O.E. =
For 95% confidence, Z = 1.96.
- The population M.O.E. =
- The sample standard deviation =
The sample M.O.E. =
300 hundred eggs were randomly chosen from a gravid female salmon and individually weighed. The mean weight was 0.978 g with a standard deviation of 0.042. Find the 95% confidence interval for the mean weight of the salmon eggs (because it is a large n, use the standard normal distribution).
300 hundred eggs were randomly chosen from a gravid female salmon and individually weighed. The mean weight was 0.978 g with a standard deviation of 0.042. Find the 95% confidence interval for the mean weight of the salmon eggs (because it is a large n, use the standard normal distribution).
Tap to see back →
Because we have such a large sample size, we are using the standard normal or z-distribution to calculate the confidence interval.
Formula:
We must find the appropriate z-value based on the given for 95% confidence:
Then, find the associated z-score using the z-table for
Now we fill in the formula with our values from the problem to find the 95% CI.
Because we have such a large sample size, we are using the standard normal or z-distribution to calculate the confidence interval.
Formula:
We must find the appropriate z-value based on the given
Then, find the associated z-score using the z-table for
Now we fill in the formula with our values from the problem to find the 95% CI.
A sample of observations of 02 consumption by adult western fence lizards gave the following statistics:
Find the confidence limit for the mean 02 consumption by adult western fence lizards.
A sample of
Find the
Tap to see back →
Because we are only given the sample standard deviation we will use the t-distribution to calculate the confidence interval.
Appropriate Formula:
Now we must identify our variables:
We must find the appropriate t-value based on the given
t-value at 90% confidence:
Look up t-value for 0.05, 55 , so t-value= ~ 1.6735
90% CI becomes:
Subject Horn Length (in) Subject Horn Length (in) 1 19.1 11 11.6 2 14.7 12 18.5 3 10.2 13 28.7 4 16.1 14 15.3 5 13.9 15 13.5 6 12.0 16 7.7 7 20.7 17 17.2 8 8.6 18 19.0 9 24.2 19 20.9 10 17.3 20 21.3
The data above represents measurements of the horn lengths of African water buffalo that were raised on calcium supplements. Construct a 95% confidence interval for the population mean for horn length after supplments.
| Subject | Horn Length (in) | Subject | Horn Length (in) |
|---|---|---|---|
| 1 | 19.1 | 11 | 11.6 |
| 2 | 14.7 | 12 | 18.5 |
| 3 | 10.2 | 13 | 28.7 |
| 4 | 16.1 | 14 | 15.3 |
| 5 | 13.9 | 15 | 13.5 |
| 6 | 12.0 | 16 | 7.7 |
| 7 | 20.7 | 17 | 17.2 |
| 8 | 8.6 | 18 | 19.0 |
| 9 | 24.2 | 19 | 20.9 |
| 10 | 17.3 | 20 | 21.3 |
The data above represents measurements of the horn lengths of African water buffalo that were raised on calcium supplements. Construct a 95% confidence interval for the population mean for horn length after supplments.
Tap to see back →
First you must calculate the sample mean and sample standard deviation of the sample.
Because we do not know the population standard deviation we will use the t-distribution to calculate the confidence intervals. We must use standard error in this formula because we are working with the standard deviation of the sampling distribution.
Formula:
To find the appropriate t-value for 95% confidence interval:
Look up in t-table and the corresponding t-value = 2.093.
Thus the 95% confidence interval is:
First you must calculate the sample mean and sample standard deviation of the sample.
Because we do not know the population standard deviation we will use the t-distribution to calculate the confidence intervals. We must use standard error in this formula because we are working with the standard deviation of the sampling distribution.
Formula:
To find the appropriate t-value for 95% confidence interval:
Look up
Thus the 95% confidence interval is:
Suppose you have a normally distributed variable with known variance. How many standard errors do you need to add and subtract from the sample mean so that you obtain 95% confidence intervals?
Suppose you have a normally distributed variable with known variance. How many standard errors do you need to add and subtract from the sample mean so that you obtain 95% confidence intervals?
Tap to see back →
To obtain 95% confidence intervals for a normal distribution with known variance, you take the mean and add/subtract . This is because 95% of the values drawn from a normally distributed sampling distribution lie within 1.96 standard errors from the sample mean.
To obtain 95% confidence intervals for a normal distribution with known variance, you take the mean and add/subtract
An automotive engineer wants to estimate the cost of repairing a car that experiences a 25 MPH head-on collision. He crashes 24 cars, and the average repair is $11,000. The standard deviation of the 24-car sample is $2,500.
Provide a 98% confidence interval for the true mean cost of repair.
An automotive engineer wants to estimate the cost of repairing a car that experiences a 25 MPH head-on collision. He crashes 24 cars, and the average repair is $11,000. The standard deviation of the 24-car sample is $2,500.
Provide a 98% confidence interval for the true mean cost of repair.
Tap to see back →
Standard deviation for the samle mean:
Since n < 30, we must use the t-table (not the z-table).
The 98% t-value for n=24 is 2.5.
Standard deviation for the samle mean:
Since n < 30, we must use the t-table (not the z-table).
The 98% t-value for n=24 is 2.5.