0%
0 / 3 answered
Understanding graphics interpretation Practice Test
•3 QuestionsQuestion
1 / 3
Q1
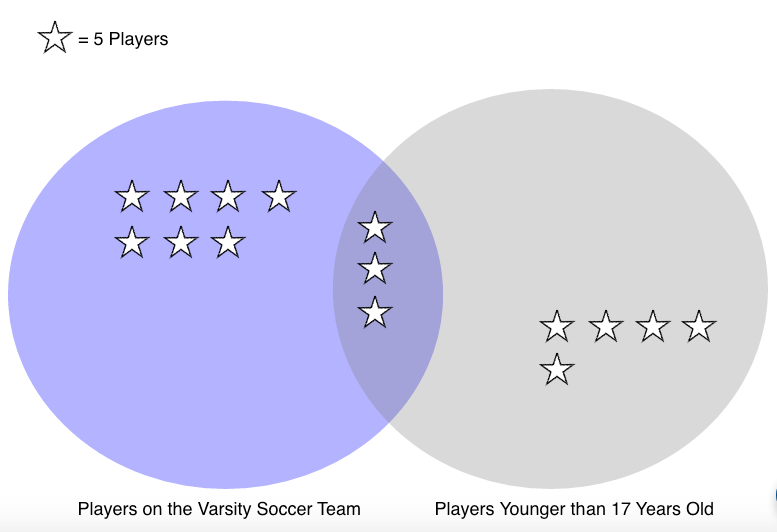
Refer to the pictograph that describes all of the students who play soccer at Douglas High School. Each star represents 5 students from a sample of 75 total students.
Identify the missing information in the following statements using the pictograph.
I. If one student is selected at random from the 75, the chance that the student will be older than 17 or on the Varsity team, or both is .
II. If one student is selected at random from the 75, the chance that the students is both younger than 17 and on the Varsity Soccer Team is .