Find the Phase Shift of a Sine or Cosine Function - Pre-Calculus
Card 0 of 28
Find the phase shift of =3sin(2t+4)") .
.
Find the phase shift of
Tap to see back →
In the formula,
=Asin(Bt-C)+D") .
.
 represents the phase shift.
Plugging in what we know gives us:
 .
.
Simplified, the phase is then  .
.
In the formula,
Plugging in what we know gives us:
Simplified, the phase is then
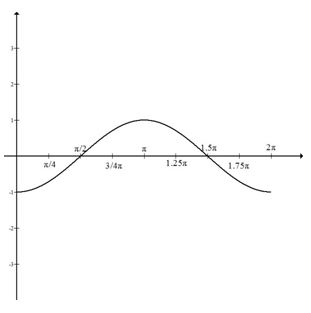
Which equation would produce this graph?
Which equation would produce this graph?
Tap to see back →
This is the graph of sine, but shifted to the right  units. To reflect this shift,
  should be subtracted from x.
Thus resulting in
") .
.
This is the graph of sine, but shifted to the right
Thus resulting in
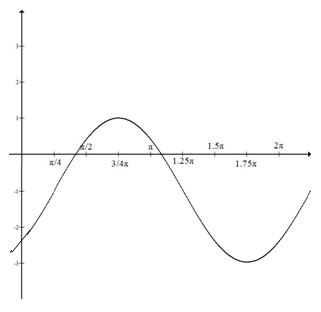
Which equation would produce this sine graph?
Which equation would produce this sine graph?
Tap to see back →
The graph has an amplitude of 2 but has been shifted down 1:
In terms of the equation, this puts a 2 in front of sin, and -1 at the end.
This makes it easier to see that the graph starts \[is at 0\] where  .
.
The phase shift is  to the right, or
  .
.
The graph has an amplitude of 2 but has been shifted down 1:
In terms of the equation, this puts a 2 in front of sin, and -1 at the end.
This makes it easier to see that the graph starts \[is at 0\] where
The phase shift is
Please choose the best answer from the following choices.
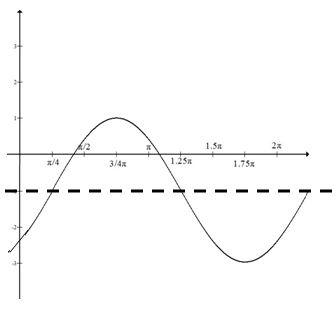
Describe the phase shift of the following function:
")
Please choose the best answer from the following choices.
Describe the phase shift of the following function:
Tap to see back →
Since  is being added inside the parentheses, there will be a horizontal shift. The goal is to maintain zero within the parentheses so you will shift left
  radians.
Since
Write the equation for a sine graph with a maximum at ") and a minimum at
and a minimum at ") .
.
Write the equation for a sine graph with a maximum at
Tap to see back →
To write this equation, it is helpful to sketch a graph:
Indicating the maximum and minimum points, we can see that this graph has been shifted up 1, and it has an amplitude of 2.
The distance from the maximum to the minimum point is half the wavelength. In this case, the wavelength is  . That means the full wavelength is
  , and the frequency is 1.
This sketch shows that the graph starts to the left of the y-axis. To figure out exactly where, subtract  from the maximum x-coordinate,
  :
:
 .
.
Our equation will be in the form ) + k") where A is the amplitude, f is the frequency, h is the horizontal shift, and k is the vertical shift.
where A is the amplitude, f is the frequency, h is the horizontal shift, and k is the vertical shift.
This graph has an equation of
 + 1") .
.
To write this equation, it is helpful to sketch a graph:
Indicating the maximum and minimum points, we can see that this graph has been shifted up 1, and it has an amplitude of 2.
The distance from the maximum to the minimum point is half the wavelength. In this case, the wavelength is
This sketch shows that the graph starts to the left of the y-axis. To figure out exactly where, subtract
Our equation will be in the form
This graph has an equation of
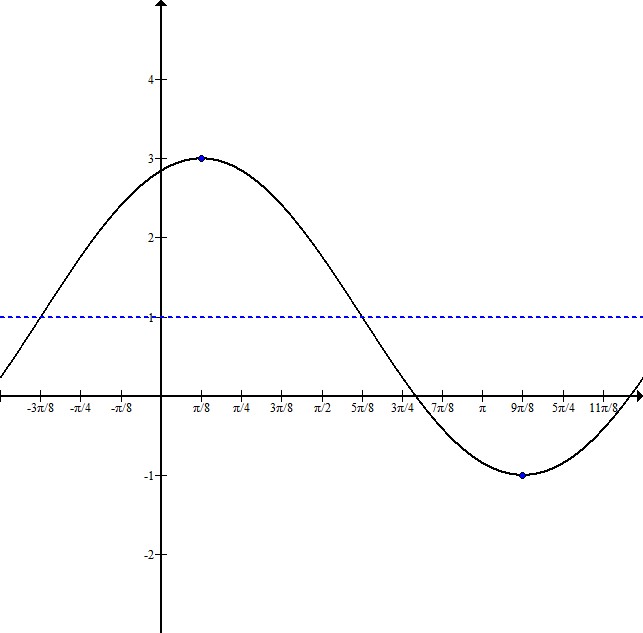
Write the equation for a cosine graph with a maximum at ") and a minimum at
and a minimum at ") .
.
Write the equation for a cosine graph with a maximum at
Tap to see back →
In order to write this equation, it is helpful to sketch a graph:
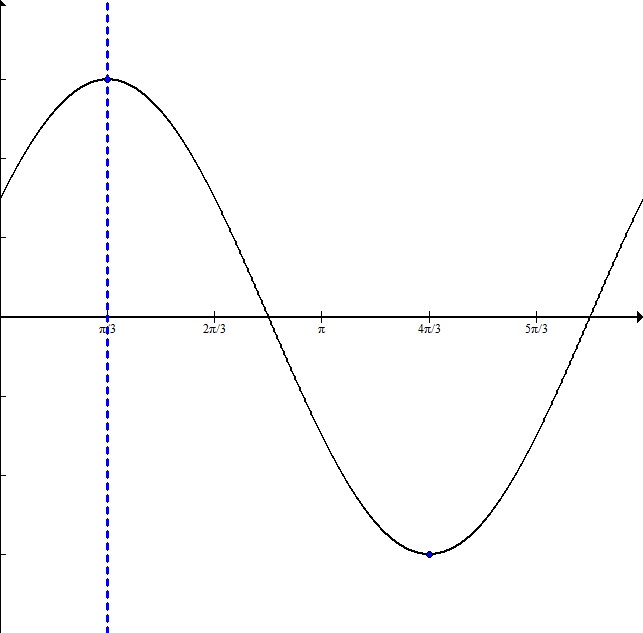
The dotted line is at  , where the maximum occurs and therefore where the graph starts. This means that the graph is shifted to the right
  .
.
The distance from the maximum to the minimum is half the entire wavelength. Here it is  .
.
Since half the wavelength is  , that means the full wavelength is
  so the frequency is just 1.
The amplitude is 3 because the graph goes symmetrically from -3 to 3.
The equation will be in the form ) + k") where A is the amplitude, f is the frequency, h is the horizontal shift, and k is the vertical shift.
where A is the amplitude, f is the frequency, h is the horizontal shift, and k is the vertical shift.
This equation is
") .
.
In order to write this equation, it is helpful to sketch a graph:
The dotted line is at
The distance from the maximum to the minimum is half the entire wavelength. Here it is
Since half the wavelength is
The amplitude is 3 because the graph goes symmetrically from -3 to 3.
The equation will be in the form
This equation is
Write the equation for a sine function with a maximum at ") and a minimum at
and a minimum at ") .
.
Write the equation for a sine function with a maximum at
Tap to see back →
The equation will be in the form ) + k") where A is the amplitude, f is the frequency, h is the horizontal shift, and k is the vertical shift.
where A is the amplitude, f is the frequency, h is the horizontal shift, and k is the vertical shift.
To write the equation, it is helpful to sketch a graph:
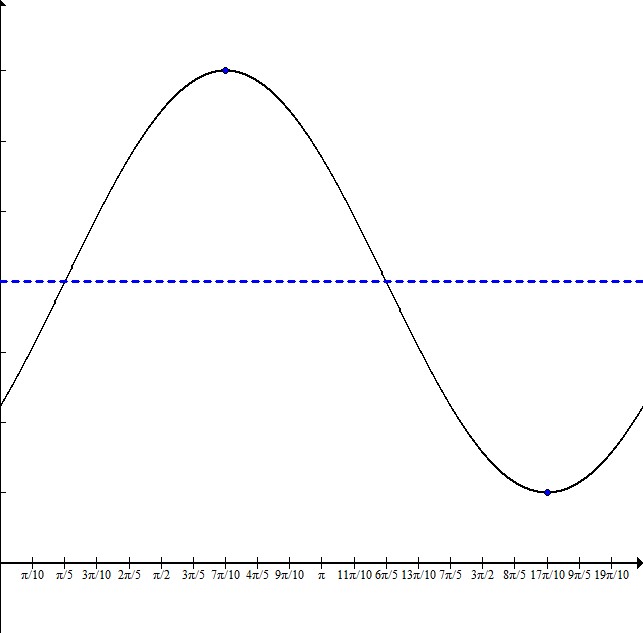
From plotting the maximum and minimum, we can see that the graph is centered on  with an amplitude of 3.
The distance from the maximum to the minimum is half the wavelength. For this graph, this distance is  .
.
This means that the total wavelength is  and the frequency is 1.
The graph starts  behind the maximum point. To determine this x value, subtract
  from the x-coordinate of the maximum:

Our equation is:
 + 4") .
.
The equation will be in the form
To write the equation, it is helpful to sketch a graph:
From plotting the maximum and minimum, we can see that the graph is centered on
The distance from the maximum to the minimum is half the wavelength. For this graph, this distance is
This means that the total wavelength is
The graph starts
Our equation is:
Find the phase shift of .
Find the phase shift of
Tap to see back →
In the formula,
.
represents the phase shift.
Plugging in what we know gives us:
.
Simplified, the phase is then .
In the formula,
Plugging in what we know gives us:
Simplified, the phase is then
Which equation would produce this graph?
Which equation would produce this graph?
Tap to see back →
This is the graph of sine, but shifted to the right units. To reflect this shift, should be subtracted from x.
Thus resulting in
.
This is the graph of sine, but shifted to the right
Thus resulting in
Which equation would produce this sine graph?
Which equation would produce this sine graph?
Tap to see back →
The graph has an amplitude of 2 but has been shifted down 1:
In terms of the equation, this puts a 2 in front of sin, and -1 at the end.
This makes it easier to see that the graph starts \[is at 0\] where .
The phase shift is to the right, or .
The graph has an amplitude of 2 but has been shifted down 1:
In terms of the equation, this puts a 2 in front of sin, and -1 at the end.
This makes it easier to see that the graph starts \[is at 0\] where
The phase shift is
Please choose the best answer from the following choices.
Describe the phase shift of the following function:
Please choose the best answer from the following choices.
Describe the phase shift of the following function:
Tap to see back →
Since is being added inside the parentheses, there will be a horizontal shift. The goal is to maintain zero within the parentheses so you will shift left radians.
Since
Write the equation for a sine graph with a maximum at and a minimum at .
Write the equation for a sine graph with a maximum at
Tap to see back →
To write this equation, it is helpful to sketch a graph:
Indicating the maximum and minimum points, we can see that this graph has been shifted up 1, and it has an amplitude of 2.
The distance from the maximum to the minimum point is half the wavelength. In this case, the wavelength is . That means the full wavelength is , and the frequency is 1.
This sketch shows that the graph starts to the left of the y-axis. To figure out exactly where, subtract from the maximum x-coordinate, :
.
Our equation will be in the form where A is the amplitude, f is the frequency, h is the horizontal shift, and k is the vertical shift.
This graph has an equation of
.
To write this equation, it is helpful to sketch a graph:
Indicating the maximum and minimum points, we can see that this graph has been shifted up 1, and it has an amplitude of 2.
The distance from the maximum to the minimum point is half the wavelength. In this case, the wavelength is
This sketch shows that the graph starts to the left of the y-axis. To figure out exactly where, subtract
Our equation will be in the form
This graph has an equation of
Write the equation for a cosine graph with a maximum at and a minimum at .
Write the equation for a cosine graph with a maximum at
Tap to see back →
In order to write this equation, it is helpful to sketch a graph:
The dotted line is at , where the maximum occurs and therefore where the graph starts. This means that the graph is shifted to the right .
The distance from the maximum to the minimum is half the entire wavelength. Here it is .
Since half the wavelength is , that means the full wavelength is so the frequency is just 1.
The amplitude is 3 because the graph goes symmetrically from -3 to 3.
The equation will be in the form where A is the amplitude, f is the frequency, h is the horizontal shift, and k is the vertical shift.
This equation is
.
In order to write this equation, it is helpful to sketch a graph:
The dotted line is at
The distance from the maximum to the minimum is half the entire wavelength. Here it is
Since half the wavelength is
The amplitude is 3 because the graph goes symmetrically from -3 to 3.
The equation will be in the form
This equation is
Write the equation for a sine function with a maximum at and a minimum at .
Write the equation for a sine function with a maximum at
Tap to see back →
The equation will be in the form where A is the amplitude, f is the frequency, h is the horizontal shift, and k is the vertical shift.
To write the equation, it is helpful to sketch a graph:
From plotting the maximum and minimum, we can see that the graph is centered on with an amplitude of 3.
The distance from the maximum to the minimum is half the wavelength. For this graph, this distance is .
This means that the total wavelength is and the frequency is 1.
The graph starts behind the maximum point. To determine this x value, subtract from the x-coordinate of the maximum:
Our equation is:
.
The equation will be in the form
To write the equation, it is helpful to sketch a graph:
From plotting the maximum and minimum, we can see that the graph is centered on
The distance from the maximum to the minimum is half the wavelength. For this graph, this distance is
This means that the total wavelength is
The graph starts
Our equation is:
Find the phase shift of .
Find the phase shift of
Tap to see back →
In the formula,
.
represents the phase shift.
Plugging in what we know gives us:
.
Simplified, the phase is then .
In the formula,
Plugging in what we know gives us:
Simplified, the phase is then
Which equation would produce this graph?
Which equation would produce this graph?
Tap to see back →
This is the graph of sine, but shifted to the right units. To reflect this shift, should be subtracted from x.
Thus resulting in
.
This is the graph of sine, but shifted to the right
Thus resulting in
Which equation would produce this sine graph?
Which equation would produce this sine graph?
Tap to see back →
The graph has an amplitude of 2 but has been shifted down 1:
In terms of the equation, this puts a 2 in front of sin, and -1 at the end.
This makes it easier to see that the graph starts \[is at 0\] where .
The phase shift is to the right, or .
The graph has an amplitude of 2 but has been shifted down 1:
In terms of the equation, this puts a 2 in front of sin, and -1 at the end.
This makes it easier to see that the graph starts \[is at 0\] where
The phase shift is
Please choose the best answer from the following choices.
Describe the phase shift of the following function:
Please choose the best answer from the following choices.
Describe the phase shift of the following function:
Tap to see back →
Since is being added inside the parentheses, there will be a horizontal shift. The goal is to maintain zero within the parentheses so you will shift left radians.
Since
Write the equation for a sine graph with a maximum at and a minimum at .
Write the equation for a sine graph with a maximum at
Tap to see back →
To write this equation, it is helpful to sketch a graph:
Indicating the maximum and minimum points, we can see that this graph has been shifted up 1, and it has an amplitude of 2.
The distance from the maximum to the minimum point is half the wavelength. In this case, the wavelength is . That means the full wavelength is , and the frequency is 1.
This sketch shows that the graph starts to the left of the y-axis. To figure out exactly where, subtract from the maximum x-coordinate, :
.
Our equation will be in the form where A is the amplitude, f is the frequency, h is the horizontal shift, and k is the vertical shift.
This graph has an equation of
.
To write this equation, it is helpful to sketch a graph:
Indicating the maximum and minimum points, we can see that this graph has been shifted up 1, and it has an amplitude of 2.
The distance from the maximum to the minimum point is half the wavelength. In this case, the wavelength is
This sketch shows that the graph starts to the left of the y-axis. To figure out exactly where, subtract
Our equation will be in the form
This graph has an equation of
Write the equation for a cosine graph with a maximum at and a minimum at .
Write the equation for a cosine graph with a maximum at
Tap to see back →
In order to write this equation, it is helpful to sketch a graph:
The dotted line is at , where the maximum occurs and therefore where the graph starts. This means that the graph is shifted to the right .
The distance from the maximum to the minimum is half the entire wavelength. Here it is .
Since half the wavelength is , that means the full wavelength is so the frequency is just 1.
The amplitude is 3 because the graph goes symmetrically from -3 to 3.
The equation will be in the form where A is the amplitude, f is the frequency, h is the horizontal shift, and k is the vertical shift.
This equation is
.
In order to write this equation, it is helpful to sketch a graph:
The dotted line is at
The distance from the maximum to the minimum is half the entire wavelength. Here it is
Since half the wavelength is
The amplitude is 3 because the graph goes symmetrically from -3 to 3.
The equation will be in the form
This equation is