Award-Winning Statistics Tutors
serving Fontana, CA
Statistics
Tutors in Fontana
Private 1-on-1 tutoring, weekly live classes for academic support, test prep & enrichment, practice tests and diagnostics, and more to elevate grades and test scores.
Based on 3.4M Learner Ratings
UniversitiesSchools & Universities
DeliveredHours Delivered
ProficiencyGrowth in Proficiency
Who needs tutoring?
No obligation. Takes ~1 minute.
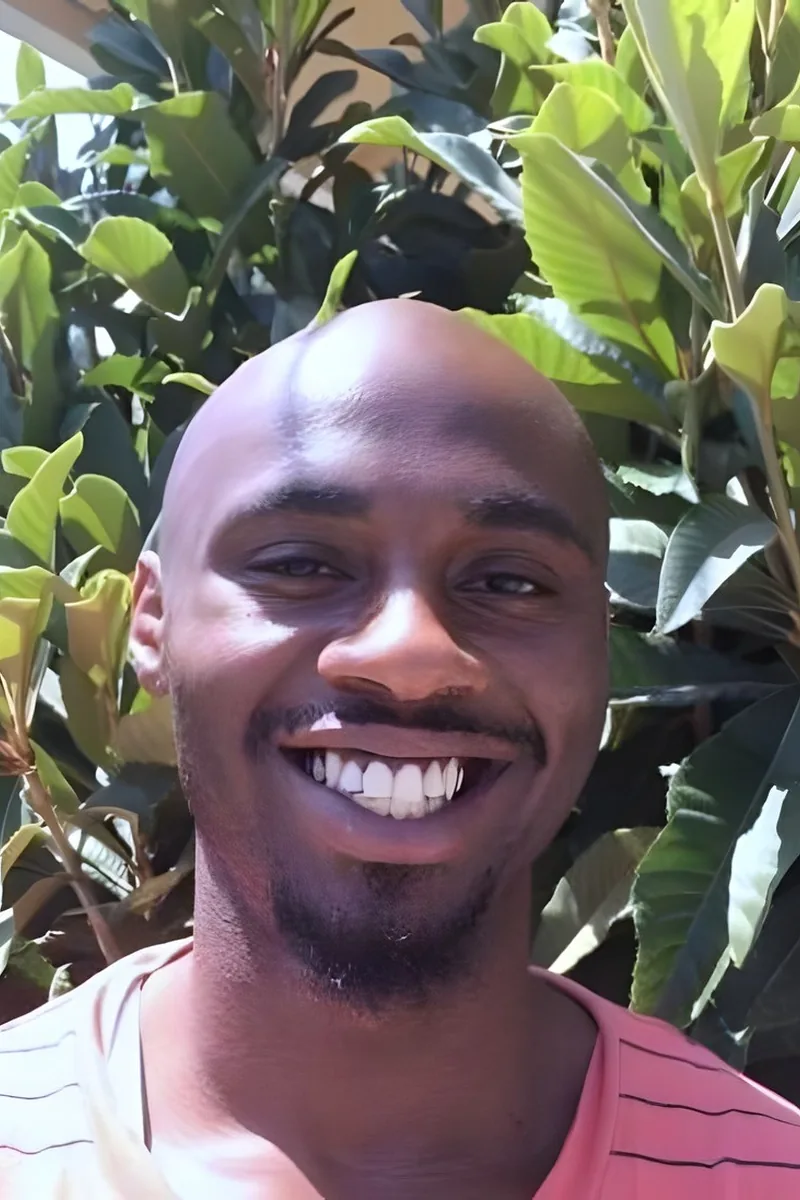
Understanding when to use a t-test versus a z-test, or why a sampling distribution behaves the way it does, requires more than formula sheets — it takes genuine statistical intuition. Brian built that intuition through his economics coursework at Caltech, where statistical analysis was a daily tool, and he walks students through each concept with concrete data examples.

Probability distributions, hypothesis testing, and confidence intervals all require a different kind of mathematical thinking — less computation, more interpretation. Mitch approaches statistics by teaching students to read what the numbers actually claim, drawing on the data analysis skills he built during his engineering degree.
Probability distributions and hypothesis testing require a different kind of mathematical thinking than most students are used to — less computation, more interpretation. Gerardo approaches statistics by anchoring every concept in a concrete scenario, whether that's reading a p-value in context or deciding which test applies to a given dataset. His teaching certification and physics training give him a structured, evidence-driven style that clicks for students who struggle with the "why" behind statistical reasoning.
Probability distributions, hypothesis testing, and confidence intervals each demand a different kind of reasoning than the algebra most students are used to. Joanne approaches statistics by grounding every formula in what it actually measures, making it easier to choose the right test and interpret results correctly.
Reading a statistics problem correctly matters as much as running the calculation, which is why Lizzy spends time on interpreting what a question actually asks before touching any formulas. She walks through probability distributions, hypothesis testing, and confidence intervals with an emphasis on understanding what the numbers mean in context.
Planning to pursue graduate work in mathematical game theory, Alain brings a probabilistic mindset to statistics that most business-econ majors don't — his math minor at UCLA meant he studied the theoretical machinery behind expected value, distributions, and hypothesis testing rather than just applying them in a spreadsheet. He teaches students to trace each statistical concept back to the underlying math so they can adapt when problems don't look like textbook examples.
The jump from calculating a mean to interpreting a confidence interval trips up students who never built intuition for what variability actually means. Mariapaz unpacks concepts like standard deviation, probability distributions, and hypothesis testing by grounding them in real data scenarios before introducing formulas. Her background teaching math across middle and high school levels means she can identify exactly where a student's conceptual understanding breaks down.
Probability distributions, hypothesis testing, and confidence intervals all hinge on understanding what the numbers actually represent — not just which formula to grab. Sarah's mathematics background at Clark University gave her the rigor to unpack statistical reasoning clearly, and her physics training means she's comfortable with real-world data that doesn't behave perfectly.
Between her sociology research in undergrad and her MBA coursework, Krupa has run enough regressions, hypothesis tests, and probability models to know exactly where students get tripped up. She tackles the conceptual side — why you'd choose a t-test over a z-test, what a p-value actually means — so the formulas stop feeling arbitrary. Her 4.9 rating speaks to how clearly she communicates these ideas.
A political science degree from Brown meant Lyall spent years interpreting polling data, regression models, and probability distributions in real research contexts. He brings that applied lens to statistics tutoring, connecting concepts like standard deviation and confidence intervals to situations where the numbers actually matter. Students get someone who treats stats as a tool for making arguments, not just a formula sheet to memorize.
Yi's graduate training in research and experimental psychology required heavy use of statistical methods — from hypothesis testing and ANOVA to regression modeling and interpreting p-values in published studies. That hands-on experience with real data analysis means she teaches statistics as a tool for answering questions, not just a set of formulas to memorize.
Working as a research assistant in Yale's cognitive neuroscience lab meant Emily ran statistical analyses regularly — hypothesis testing, probability distributions, and interpreting p-values were part of her daily routine. That hands-on experience makes her especially effective at explaining why a statistical method works, not just how to execute it on a calculator.
Designing and optimizing light filters for optical multiplexers at Norfolk State required Dennis to apply statistical methods to real engineering data — fitting distributions, quantifying uncertainty, and interpreting experimental results. He teaches statistics with that practitioner's perspective, making topics like standard deviation, probability, and regression feel like problem-solving tools rather than abstract formulas.
Probability distributions, hypothesis testing, and regression analysis are central to both engineering and business — and Caroline has graduate-level training in both. Her mechanical engineering M.S. from WashU built her statistical modeling skills, while her current MBA at MIT Sloan sharpens how she interprets data for real-world decisions. She teaches the reasoning behind each method so formulas stop feeling like black boxes.
Understanding when to use a standard deviation versus an interquartile range — or why a skewed distribution changes your entire analysis — requires more than formula memorization. Vinson approaches statistics through data interpretation first, walking through probability distributions, hypothesis testing, and regression with an emphasis on what the numbers actually tell you. He's studying computational math at Rice, where statistical reasoning is woven into his daily coursework.
Probability distributions, hypothesis testing, and regression analysis all click faster when you've actually used them to make decisions. Hari's finance background means he's applied statistical methods to real datasets — forecasting, risk analysis, variance modeling — and he teaches the logic behind each test so students can choose the right approach on their own.
Understanding statistics means learning to ask the right questions about data before running any test: Is the sample random? What's the shape of the distribution? Could this result have happened by chance? Ethan's policy background gave him years of practice interrogating datasets and translating statistical output into plain-language conclusions, a skill he now brings directly to topics like hypothesis testing and regression analysis.
Studying economics at Brown meant Carter lived inside datasets — running regressions, testing hypotheses, and interpreting distributions long before he started tutoring. That firsthand experience makes him especially effective at teaching concepts like standard deviation, normal models, and conditional probability in ways that feel grounded rather than abstract. He's rated 5.0 by students.
As an economics major at Yale, Conor uses statistical methods constantly — regression analysis, probability distributions, hypothesis testing — so he teaches statistics as a practical toolkit rather than an abstract set of formulas. He's especially sharp at walking through the logic behind concepts like p-values and confidence intervals, which tend to confuse students who try to memorize procedures without understanding what the numbers actually mean.
Most students can plug numbers into a standard deviation formula — the harder part is interpreting what the result actually means in context. Joshitha approaches statistics by connecting every calculation to real-world reasoning: why a confidence interval narrows, what a p-value does and doesn't tell you. Her engineering background at Johns Hopkins means she uses statistical thinking constantly and can show students where these ideas live outside the textbook.
Testimonials
Because the right Statistics tutor makes all the difference.
Average Session Rating – Based on 3.4M Learner Ratings
Practice Statistics
Free practice tests, flashcards, and AI tutoring for Statistics
Nearby Statistics Tutors
Other Fontana Tutors
Related Math Tutors in Fontana
Frequently Asked Questions
Varsity Tutors matches Fontana students with expert Statistics tutors for 1-on-1 instruction. We pair each student with a tutor based on their specific needs, learning style, and goals.
Whether you need homework help, exam prep, or want to get ahead, our Statistics tutors are ready to help.
Common challenges include gaps from earlier material, difficulty with specific concepts, and trouble applying learning to new problems. These issues can snowball quickly in Statistics.
A tutor identifies where you're stuck, fills in gaps, and provides targeted practice. The 1-on-1 format means you get help exactly where you need it.
Tutors work with your student's actual coursework—homework assignments, class notes, and upcoming tests. This keeps tutoring directly relevant to what's happening in the classroom.
When you share information about your student's school and curriculum, we can match you with a tutor who has relevant experience.
All tutors complete background checks, credential verification, and teaching evaluation. Many of our Statistics tutors hold advanced degrees or have years of teaching experience.
You can review tutor profiles to find someone with the right background for your student's level and needs.
Many students see improved grades within a few weeks, along with better understanding of Statistics concepts and more confidence tackling challenging material.
Tutors track progress and adjust their approach to ensure continued improvement.
Most students benefit from 1-2 sessions per week. More frequent sessions help if your student is significantly behind or has an important exam coming up.
Your tutor can recommend a schedule based on your student's specific situation and goals.
Tutoring is purchased in packages of hours, with rates varying by tutor experience. Varsity Tutors offers several options to fit different budgets and needs.
You can discuss pricing during your consultation to find what works best.
Your tutor will assess where your student is, discuss goals, and start working on priority areas. Most students bring current homework or upcoming test material to focus on.
By the end, you'll have a clear sense of how the tutor can help and a plan for moving forward.
Let’s find your perfect tutor
Answer a few quick questions. We’ll recommend the right plan and match you with a top 5% tutor.