GMAT Integrated Reasoning : Graphics Interpretation
Study concepts, example questions & explanations for GMAT Integrated Reasoning


All GMAT Integrated Reasoning Resources
Example Questions
Example Question #1 : Gmat Integrated Reasoning
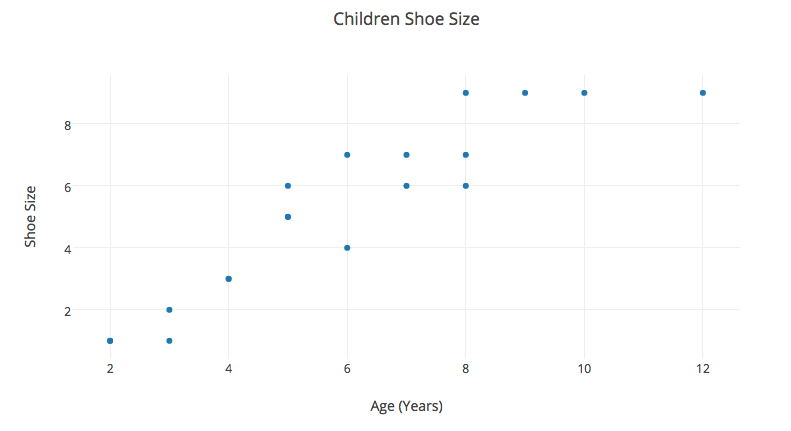
The graph above plots sixteen points that each describe the shoe size of sixteen individual children.
Identify the missing information of the following statement.
The relationship between the age of the child and the child's shoe size is __________.
zero
positive
negative
positive
Looking at the graph, first identify the points.
There are sixteen points: (2,1), (3,1), (3,2), (4,3), (5,5), (5,6), (6,4), (6, 7), (7,6), (7,7), (8,6), (8,7), (8,9), (9,9), (10,9), (12,9)
The line of best fit can be drawn on the image and it would have a positive slope.
It is seen that as the age of the children increases that the shoe size also increases.
Therefore there is a positive relationship between the child's age and shoe size.
Example Question #2 : Understanding Graphics Interpretation
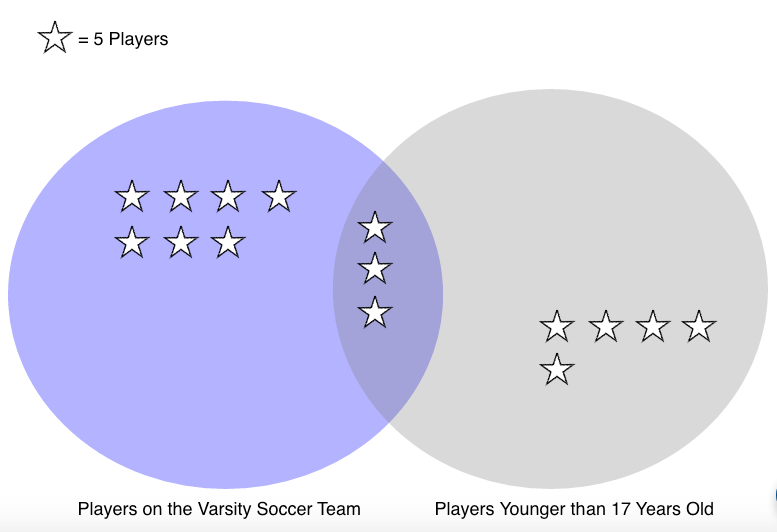
Refer to the pictograph that describes all of the students who play soccer at Douglas High School. Each star represents 5 students from a sample of 75 total students.
Identify the missing information in the following statements using the pictograph.
I. If one student is selected at random from the 75, the chance that the student will be older than 17 or on the Varsity team, or both is __________.
II. If one student is selected at random from the 75, the chance that the students is both younger than 17 and on the Varsity Soccer Team is __________.
I. 1 out of 3
II. 1 out of 5
I. 2 out of 5
II. 2 out of 6
I. 2 out of 6
II. 2 out of 5
I. 2 out of 3
II. 1 out of 5
I. 1 out of 5
II. 2 out of 3
I. 2 out of 3
II. 1 out of 5
To identify the missing information in the following statements use the pictograph.
I. If one student is selected at random from the 75, the chance that the student will be older than 17 or on the Varsity team, or both is __________.
To find the probability of choosing a student that is either older than 17, or on the Varsity team, or both can be written mathematically as follows.
+P(<17\cap VT) \\35+15 \\50")
To find the ratio divide the number found above by the total number of students.

In words this is 2 out of 3.
II. If one student is selected at random from the 75, the chance that the students is both younger than 17 and on the Varsity Soccer Team is __________.
In mathematical terms this is written as the following,
 \\15")
To find the ratio divide the number found above by the total number of students.

In words this is 1 out of 5.
Example Question #3 : Understanding Graphics Interpretation
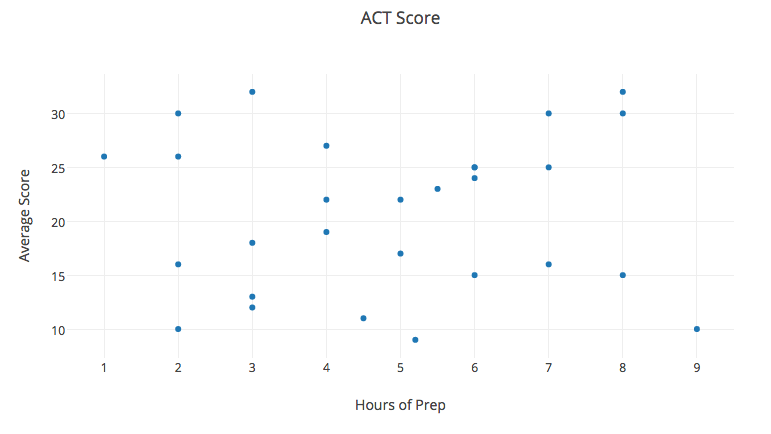
The graph depicts the hours prep time for students who took the ACT test and their corresponding average score.
Identify the missing information for the following statements using the graph.
I. The relationship between study time and test scores is __________.
II. The slope of the regression line is __________ .
I. zero
II. non-applicable
I. negative
II. positive
I. positive
II. positive
I. zero
II. positive
I. positive
II. not determined
I. zero
II. non-applicable
To identify the missing information for the following statements use the graph.
I. The relationship between study time and test scores is __________.
Since the scatterplot shows no clear trend, the relationship between the study time and the test score is zero.
II. The slope of the regression line is __________ .
Since there is no relationship between the study time and the average test score, a regression line in non-applicable.
Example Question #4 : Gmat Integrated Reasoning
The graph above plots sixteen points that each describe the shoe size of sixteen individual children.
Identify the missing information of the following statement.
The relationship between the age of the child and the child's shoe size is __________.
positive
negative
zero
positive
Looking at the graph, first identify the points.
There are sixteen points: (2,1), (3,1), (3,2), (4,3), (5,5), (5,6), (6,4), (6, 7), (7,6), (7,7), (8,6), (8,7), (8,9), (9,9), (10,9), (12,9)
The line of best fit can be drawn on the image and it would have a positive slope.
It is seen that as the age of the children increases that the shoe size also increases.
Therefore there is a positive relationship between the child's age and shoe size.
Example Question #5 : Gmat Integrated Reasoning
Refer to the pictograph that describes all of the students who play soccer at Douglas High School. Each star represents 5 students from a sample of 75 total students.
Identify the missing information in the following statements using the pictograph.
I. If one student is selected at random from the 75, the chance that the student will be older than 17 or on the Varsity team, or both is __________.
II. If one student is selected at random from the 75, the chance that the students is both younger than 17 and on the Varsity Soccer Team is __________.
I. 1 out of 5
II. 2 out of 3
I. 2 out of 3
II. 1 out of 5
I. 1 out of 3
II. 1 out of 5
I. 2 out of 5
II. 2 out of 6
I. 2 out of 6
II. 2 out of 5
I. 2 out of 3
II. 1 out of 5
To identify the missing information in the following statements use the pictograph.
I. If one student is selected at random from the 75, the chance that the student will be older than 17 or on the Varsity team, or both is __________.
To find the probability of choosing a student that is either older than 17, or on the Varsity team, or both can be written mathematically as follows.
To find the ratio divide the number found above by the total number of students.
In words this is 2 out of 3.
II. If one student is selected at random from the 75, the chance that the students is both younger than 17 and on the Varsity Soccer Team is __________.
In mathematical terms this is written as the following,
To find the ratio divide the number found above by the total number of students.
In words this is 1 out of 5.
Example Question #6 : Gmat Integrated Reasoning
The graph depicts the hours prep time for students who took the ACT test and their corresponding average score.
Identify the missing information for the following statements using the graph.
I. The relationship between study time and test scores is __________.
II. The slope of the regression line is __________ .
I. zero
II. non-applicable
I. positive
II. positive
I. negative
II. positive
I. zero
II. positive
I. positive
II. not determined
I. zero
II. non-applicable
To identify the missing information for the following statements use the graph.
I. The relationship between study time and test scores is __________.
Since the scatterplot shows no clear trend, the relationship between the study time and the test score is zero.
II. The slope of the regression line is __________ .
Since there is no relationship between the study time and the average test score, a regression line in non-applicable.


All GMAT Integrated Reasoning Resources

