AP Statistics : How to use boxplots to summarize a data set
Study concepts, example questions & explanations for AP Statistics


All AP Statistics Resources
Example Questions
Example Question #241 : Ap Statistics
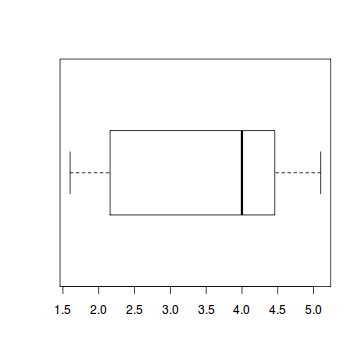
Which of the following is true based on the box plot?
i. The mean is 
ii. The range is approximately 
iii. The IQR is approximatly 
iii only
i,ii, and iii
ii only
i and ii
ii and iii
iii only
The median, not the mean is 


Example Question #1 : Using Box And Whisker Plots
The horizontal line in the box of the box and whisker plot represents _____________.

Median
Mean
Range
Mode
Interquartile range
Median
A box and whisker plot separates the data into quartiles so that each quartile has an equal number of data points. The box indicates the interquartile range, that is, the top line of the box is the third quartile and the bottom line of the box is the second quartile. The line separating the second and third quartiles indicates the median. The lines outside of the box indicate the outer-quartiles (first and fourth).
Example Question #3 : How To Use Boxplots To Summarize A Data Set
A distribution has a minimum of 


- The interquartile range is
.
- The distribution is skewed left.
- The range is
.
1 only
2 and 3
1 and 2
1, 2 and 3
1 and 3
1 and 3
1) and 3) come easily because of straightforward calculations - it's 2 that's the tough part.
1) is true because the interquartile range is defined as the third quartile minus the first quartile.

3) is true because the range of a data set is the difference of the maximum value and the minimum value.

Notice that the median is closer to the first quartile, indicating that the distribution is skewed right. (If the median were closer to the third quartile, that would indicate a distribution that is skewed left.) It can help to draw the boxplot of the data set in order to visualize it.
Example Question #244 : Ap Statistics
Which data set could be represented by the following boxplot? 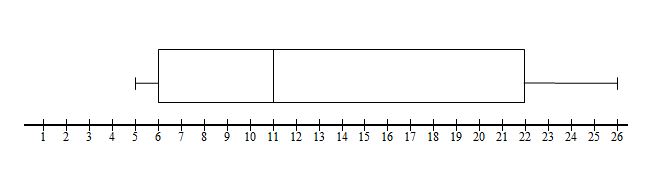


This boxplot is representing a data set with a median of 11. The data set


To determine which of the remaining choices matches the boxplot, find the first and third quartiles. To find the first quartile, find the median of the lower half, excluding the median, in each case 11.


The boxplot shown has the lower end of the rectangle at 6, so the last data set listed is the correct answer.
Example Question #41 : Univariate Data Descriptors
Which data set would be represented by this boxplot?
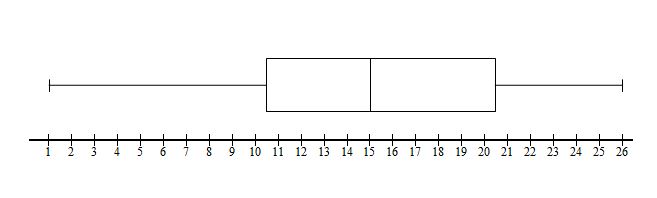


A boxplot indicates the quartiles of the data set. In this case we can see that the median or second quartile is 15. We can immediately eliminate

Now we need to find the data set with the correct first and third quartile. The boxplot indicates that our first quartile is 10.5. We can find Q1 by finding the median of the lower half, not including the median:


Example Question #1 : How To Use Boxplots To Summarize A Data Set
Which statement about the data represented by this boxplot is not true?
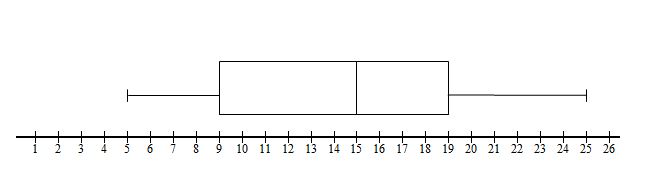
The interquartile range is 10.
The third quartile is 9.
The range is exactly twice the interquartile range.
The median is 15.
The third quartile is 9.
In order to get this question right, we need to be able to distinguish between the first and the third quartile.
The third quartile, 19, is the median of the upper half of the data.
The first quartile, 9, is the median of the lower half of the data.
This means that the "correct" wrong statement is "the third quartile is 9," since 9 is the first quartile.


All AP Statistics Resources

