ISEE Primary 2 Math : Data Analysis and Probability
Study concepts, example questions & explanations for ISEE Primary 2 Math


All ISEE Primary 2 Math Resources
Example Questions
Example Question #1 : Data Analysis And Probability
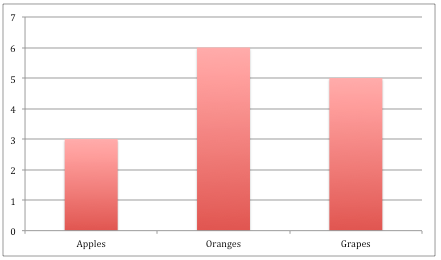
Look at the chart below. If we add 
Possible Answers:


Correct answer:
Explanation:
Looking at the graph, we first need to figure out how many apples we are starting with. We are starting with 


Example Question #1 : Data Analysis And Probability
Look at the chart below. How many grapes are there?
Possible Answers:


Correct answer:
Explanation:
In the chart, grapes are shown in the last bar, on the right. That bar goes up to the number 


All ISEE Primary 2 Math Resources
Popular Subjects
GMAT Tutors in Miami, GMAT Tutors in Houston, Biology Tutors in New York City, ISEE Tutors in Denver, English Tutors in San Francisco-Bay Area, English Tutors in Los Angeles, Computer Science Tutors in San Diego, Statistics Tutors in Houston, Computer Science Tutors in Miami, Reading Tutors in Phoenix
Popular Courses & Classes
SAT Courses & Classes in Atlanta, GMAT Courses & Classes in Dallas Fort Worth, MCAT Courses & Classes in Philadelphia, LSAT Courses & Classes in Los Angeles, MCAT Courses & Classes in Dallas Fort Worth, SSAT Courses & Classes in Phoenix, ISEE Courses & Classes in Atlanta, GRE Courses & Classes in Atlanta, ACT Courses & Classes in Phoenix, ACT Courses & Classes in Miami

