ISEE Upper Level Math : Data Analysis

Study concepts, example questions & explanations for ISEE Upper Level Math

varsity tutors app store varsity tutors android store

Example Questions

Example Question #1 : How To Use A Venn Diagram

Venn


Refer to the above Venn diagram.

Define universal set \(\displaystyle U = \mathbb{N}\), the set of natural numbers.

Define sets \(\displaystyle A\) and \(\displaystyle B\) as follows:

\(\displaystyle A = \left \{ 1,5,9,13,17,21,... \right \}\)

\(\displaystyle B = \left \{ 2,5,8,11,14,17...\right \}\)

Which of the following numbers is an element of the set represented by the gray area in the diagram?

Possible Answers:

\(\displaystyle 102\)

\(\displaystyle 101\)

\(\displaystyle 104\)

\(\displaystyle 105\)

\(\displaystyle 103\)

Correct answer:

\(\displaystyle 104\)

Explanation:

The gray area represents the set of all elements that are in \(\displaystyle B\) but not in \(\displaystyle A\).

\(\displaystyle B\) is the set of integers that, when divided by 3, yield remainder 2. Therefore, we can eliminate 102 and 105, both multiples of 3, and 103, which, when divided by 3, yields remainder 1.

\(\displaystyle A\) is the set of integers that, when divided by 4, yield remainder 1. Since we do not want an element from this set, we can eliminate 101, but not 104. 

104 is the correct choice.

Example Question #2 : How To Use A Venn Diagram

Venn

In the above Venn diagram, the universal set is defined as  \(\displaystyle U = \left \{ a, b, c, d, e, f, g, h\right \}\). Each of the eight letters is placed in its correct region.

What is \(\displaystyle A \cap B\) ?

Possible Answers:

\(\displaystyle A \cap B = \left \{ a,f \right \}\)

\(\displaystyle A \cap B = \left \{ a,c,f \right \}\)

\(\displaystyle A \cap B = \left \{ b,d,e,g,h \right \}\)

\(\displaystyle A \cap B = \left \{ b,c,d,e,g,h \right \}\)

\(\displaystyle A \cap B = \left \{ a,b,d,e,f,g,h \right \}\)

Correct answer:

\(\displaystyle A \cap B = \left \{ a,f \right \}\)

Explanation:

\(\displaystyle A \cap B\) is the intersection of sets \(\displaystyle A\) and \(\displaystyle B\) - that is, the set of all elements of \(\displaystyle U\) that are elements of both \(\displaystyle A\) and \(\displaystyle B\). We want all of the letters that fall in both circles, which from the diagram can be seen to be \(\displaystyle a\) and \(\displaystyle f\). Therefore, 

\(\displaystyle A \cap B = \left \{ a,f \right \}\)

Example Question #3 : How To Use A Venn Diagram

Venn

In the above Venn diagram, the universal set is defined as  \(\displaystyle U = \left \{ a, b, c, d, e, f, g, h\right \}\). Each of the eight letters is placed in its correct region. Which of the following is equal to \(\displaystyle \overline{A\cap B}\) ?

Possible Answers:

\(\displaystyle \overline{A\cap B} = \left \{ a,c,f\right \}\)

\(\displaystyle \overline{A\cap B} = \left \{ a,f\right \}\)

\(\displaystyle \overline{A\cap B} = \left \{ b,d,e,g,h\right \}\)

\(\displaystyle \overline{A\cap B} = \left \{ c\right \}\)

\(\displaystyle \overline{A\cap B} = \left \{ b,c,d,e,g,h\right \}\)

Correct answer:

\(\displaystyle \overline{A\cap B} = \left \{ b,c,d,e,g,h\right \}\)

Explanation:

\(\displaystyle \overline{A \cap B}\)  is the complement of \(\displaystyle A \cap B\) - the set of all elements in \(\displaystyle U\) not in \(\displaystyle A \cap B\)

\(\displaystyle A \cap B\) is the intersection of sets \(\displaystyle A\) and \(\displaystyle B\) - that is, the set of all elements of \(\displaystyle U\) that are elements of both \(\displaystyle A\) and \(\displaystyle B\). Therefore, \(\displaystyle \overline{A \cap B}\) is the set of all elements that are not in both \(\displaystyle A\) and \(\displaystyle B\), which can be seen from the diagram to be all elements except \(\displaystyle a\) and \(\displaystyle f\). Therefore, 

\(\displaystyle \overline{A\cap B} = \left \{ b,c,d,e,g,h\right \}\).

Example Question #4 : Data Analysis And Probability

Venn

In the above Venn diagram, the universal set is defined as  \(\displaystyle U = \left \{ a, b, c, d, e, f, g, h\right \}\). Each of the eight letters is placed in its correct region. Which of the following is equal to \(\displaystyle \overline{A\cup B}\) ?

Possible Answers:

\(\displaystyle \overline{A\cup B} = \left \{ c\right \}\)

\(\displaystyle \overline{A\cup B} = \left \{ a,c,f\right \}\)

\(\displaystyle \overline{A\cup B} = \left \{ a,f\right \}\)

\(\displaystyle \overline{A\cup B} = \left \{ b,d,e,g,h\right \}\)

\(\displaystyle \overline{A\cup B} = \left \{ b,c,d,e,g,h\right \}\)

Correct answer:

\(\displaystyle \overline{A\cup B} = \left \{ c\right \}\)

Explanation:

\(\displaystyle \overline{A\cup B}\) is the complement of \(\displaystyle A\cup B\) - the set of all elements in \(\displaystyle U\) not in \(\displaystyle A\cup B\).

\(\displaystyle A\cup B\) is the union of sets \(\displaystyle A\) and \(\displaystyle B\) - the set of all elements in either \(\displaystyle A\) or \(\displaystyle B\). Therefore, \(\displaystyle \overline{A\cup B}\) is the set of all elements in neither \(\displaystyle A\) nor \(\displaystyle B\), which can be seen from the diagram to be only one element - \(\displaystyle c\). Therefore, 

\(\displaystyle \overline{A\cup B} = \left \{ c\right \}\)

Example Question #551 : Isee Upper Level (Grades 9 12) Mathematics Achievement

The following Venn diagram depicts the number of students who play hockey, football, and baseball. How many students play football and baseball?

Problem_9

Possible Answers:

\(\displaystyle 50\)

\(\displaystyle 6\)

\(\displaystyle 3\)

\(\displaystyle 53\)

Correct answer:

\(\displaystyle 6\)

Explanation:

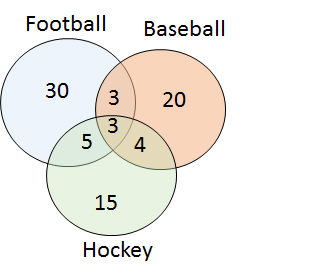
The number of students who play football or baseball can by finding the summer of the number of students who play football alone, baseball alone, baseball and football, and all three sports.

\(\displaystyle 30+20+3+3=56\)

Example Question #2 : Data Analysis And Probability

A class of \(\displaystyle 30\) students was asked whether they have cats, dogs, or both.The results are depicted in the following Venn diagram. How many students do not have a dog?

Question_5

Possible Answers:

\(\displaystyle 9\)

\(\displaystyle 19\)


\(\displaystyle 11\)

\(\displaystyle 21\)

Correct answer:

\(\displaystyle 19\)


Explanation:

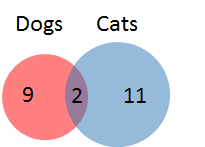
First, calculate the number of students with a dog:
\(\displaystyle 9+2=11\)

Next, subtract the number of students with a dog from the total number of students.

\(\displaystyle 30-11=19\)

Example Question #1 : Data Analysis

If a standard die is rolled, what is the probability of getting a 1 or a 2?

Possible Answers:

\dpi{100} \frac{1}{2}\(\displaystyle \dpi{100} \frac{1}{2}\)

\dpi{100} \frac{1}{3}\(\displaystyle \dpi{100} \frac{1}{3}\)

\dpi{100} \frac{1}{6}\(\displaystyle \dpi{100} \frac{1}{6}\)

\dpi{100} 2\(\displaystyle \dpi{100} 2\)

Correct answer:

\dpi{100} \frac{1}{3}\(\displaystyle \dpi{100} \frac{1}{3}\)

Explanation:

We need to know the total number of possibilities, and the total number of ways to achieve our goal.

A standard die has 6 faces, so there are a total of 6 numbers that we could roll.

We want to roll a 1 or a 2, which means there are 2 ways that we can succeed (rolling a 1 or a 2).

Thus, we have a probability of success as \dpi{100} \frac{2}{6}\(\displaystyle \dpi{100} \frac{2}{6}\) which reduces to \dpi{100} \frac{1}{3}\(\displaystyle \dpi{100} \frac{1}{3}\).

Example Question #2 : Data Analysis

The beverage menu from a restaurant reads as follows:

\(\displaystyle \begin{matrix} \textrm{\underline{Beverage}} & \textrm{\underline{Price}} \\ \textrm{Soda}& \$1.29 \\ \textrm{Iced Tea} & \$1.39 \\ \textrm{Coffee} & \$1.69 \\ \textrm{Hot Tea} & \$1.59 \\ \textrm{Milk} & \$1.49 \end{matrix}\)

Ten friends go out for drinks. They order four sodas, two coffees, two iced teas, a milk, and a hot tea. One of the ten agrees to leave the entire amount of the tip, which is to be 20% of the check. What is the amount of the tip (round to the nearest dime)?

Possible Answers:

\(\displaystyle \$ 2.90\)

\(\displaystyle \$ 3.50\)

\(\displaystyle \$ 3.10\)

\(\displaystyle \$ 2.70\)

\(\displaystyle \$ 3.30\)

Correct answer:

\(\displaystyle \$ 2.90\)

Explanation:

The costs of the beverages will be as follows:

\(\displaystyle \begin{matrix} \textrm{4 Sodas}& \4 \times $1.29 = \$5.16 \\ \textrm{2 Iced Teas} & 2 \times \$1.39 = \$2.78 \\ \textrm{2 Coffees} &2 \times \$1.69 = \$3.38 \\ \textrm{1 Hot Tea} & \$1.59 \\ \textrm{1 Milk} & \$1.49 \end{matrix}\)

Add these amounts:

\(\displaystyle \begin{matrix} \; \$5.16\\ \; \; 2.78\\ \; \; 3.38\\ \; \; 1.59\\\; \; \underline{1.49}\\ \$14.40 \end{matrix}\)

20% of $14.40 is \(\displaystyle 14.40 \times 0.20 = 2.88\) , or $2.90 when rounded to the nearest dime. 

Example Question #3 : Data Analysis

Temperature

Refer to the above graph, which shows the high temperatures in the town of Smithville over seven days.

On how many days that week did Smithville see a peak temperature 75 degrees or greater?

Possible Answers:

\(\displaystyle 7\)

\(\displaystyle 5\)

\(\displaystyle 4\)

\(\displaystyle 3\)

\(\displaystyle 6\)

Correct answer:

\(\displaystyle 4\)

Explanation:

There were four days that saw a peak temperature of 75 degrees or greater:

Monday: 76 degrees

Tuesday: 80 degrees

Wednesday: 77 degrees

Friday: 78 degrees

Example Question #4 : Data Analysis

Temperature

Refer to the above graph, which shows the high temperatures in the town of Smithville over seven days.

Which day of this week saw the highest peak temperature?

Possible Answers:

Tuesday

Wednesday

Friday

Monday

Thursday

Correct answer:

Tuesday

Explanation:

The highest point on the line graph is located at Tuesday.

Learning Tools by Varsity Tutors