Common Core: 1st Grade Math : Representing and Interpreting Data
Study concepts, example questions & explanations for Common Core: 1st Grade Math


All Common Core: 1st Grade Math Resources
Example Questions
Example Question #1 : Representing And Interpreting Data
Look at the chart below. What is there the most of?
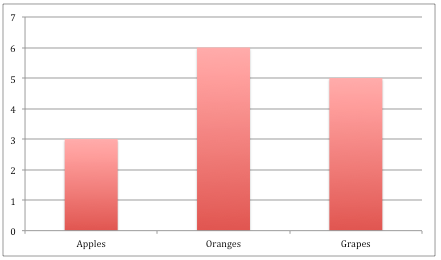
Apples
Oranges
Grapes
Oranges
There are 


Example Question #2 : Representing And Interpreting Data
Look at the chart below. How many apples are there?


In the chart, apples are shown in the first bar. That bar goes up to the number 

Example Question #1 : Organize, Represent, And Interpret Data: Ccss.Math.Content.1.Md.C.4
Look at the chart below. How many oranges are there?


In the chart, oranges are shown in the second bar. That bar goes up to the number 

Example Question #1 : Organize, Represent, And Interpret Data: Ccss.Math.Content.1.Md.C.4
Look at the chart below. How many grapes are there?


In the chart, grapes are shown in the last bar. That bar goes up to the number 

Example Question #1 : Representing And Interpreting Data
Look at the chart below. How many more oranges are there than apples?


There are 


Example Question #2 : Representing And Interpreting Data
Look at the chart below. If we add 


We are starting with 


Example Question #3 : Representing And Interpreting Data
Look at the chart below. If we add 


We are starting with 


Example Question #2 : Representing And Interpreting Data
Look at the chart below. If we add 


We have 


Example Question #43 : Tables
Look at the chart below. If we take away 


We are starting with 


Example Question #1281 : Common Core Math: Grade 1
Look at the chart below. How many more grapes are there than apples?


There are 


Certified Tutor


All Common Core: 1st Grade Math Resources

