SAT Math : Graphing
Study concepts, example questions & explanations for SAT Math


All SAT Math Resources
Example Questions
Example Question #1 : How To Graph A Two Step Inequality
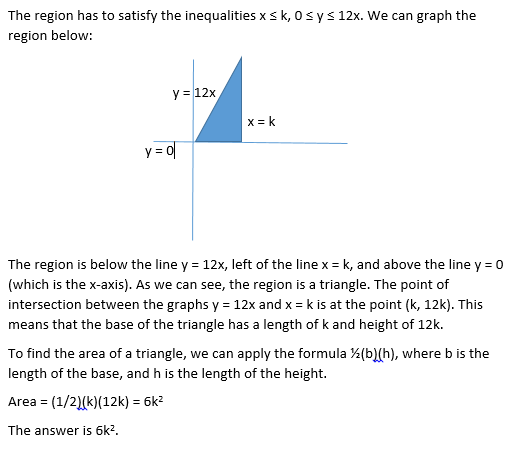
Let D be the region on the (x,y) coordinate plane that contains the solutions to the following inequalities:


Which of the following expressions, in terms of 


Example Question #121 : Coordinate Geometry
Which of the following could be a value of 


The graph is a down-opening parabola with a maximum of 
Example Question #2 : How To Graph A Function
The figure above shows the graph of y = f(x). Which of the following is the graph of y = |f(x)|?
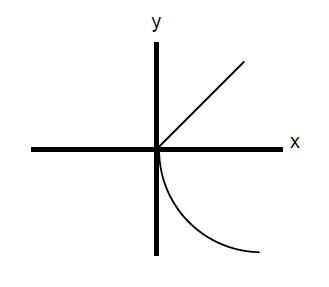
One of the properties of taking an absolute value of a function is that the values are all made positive. The values themselves do not change; only their signs do. In this graph, none of the y-values are negative, so none of them would change. Thus the two graphs should be identical.
Example Question #122 : Coordinate Geometry
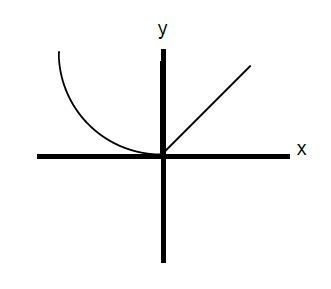
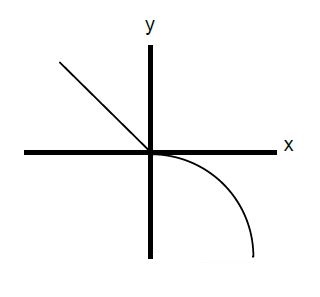
Below is the graph of the function ")
Which of the following could be the equation for ")
=\left | x^2-4x \right |-3")
=\left | 2x-2 \right |-4")
=\left | 2x-6 \right |")
=x^2-4x+3")
=\left | x-1 \right |-2")
First, because the graph consists of pieces that are straight lines, the function must include an absolute value, whose functions usually have a distinctive "V" shape. Thus, we can eliminate f(x) = x2 – 4x + 3 from our choices. Furthermore, functions with x2 terms are curved parabolas, and do not have straight line segments. This means that f(x) = |x2 – 4x| – 3 is not the correct choice.
Next, let's examine f(x) = |2x – 6|. Because this function consists of an abolute value by itself, its graph will not have any negative values. An absolute value by itself will only yield non-negative numbers. Therefore, because the graph dips below the x-axis (which means f(x) has negative values), f(x) = |2x – 6| cannot be the correct answer.
Next, we can analyze f(x) = |x – 1| – 2. Let's allow x to equal 1 and see what value we would obtain from f(1).
f(1) = | 1 – 1 | – 2 = 0 – 2 = –2
However, the graph above shows that f(1) = –4. As a result, f(x) = |x – 1| – 2 cannot be the correct equation for the function.
By process of elimination, the answer must be f(x) = |2x – 2| – 4. We can verify this by plugging in several values of x into this equation. For example f(1) = |2 – 2| – 4 = –4, which corresponds to the point (1, –4) on the graph above. Likewise, if we plug 3 or –1 into the equation f(x) = |2x – 2| – 4, we obtain zero, meaning that the graph should cross the x-axis at 3 and –1. According to the graph above, this is exactly what happens.
The answer is f(x) = |2x – 2| – 4.
Example Question #3 : Graphing
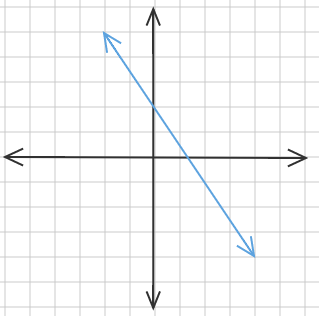
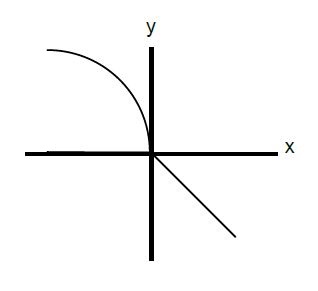
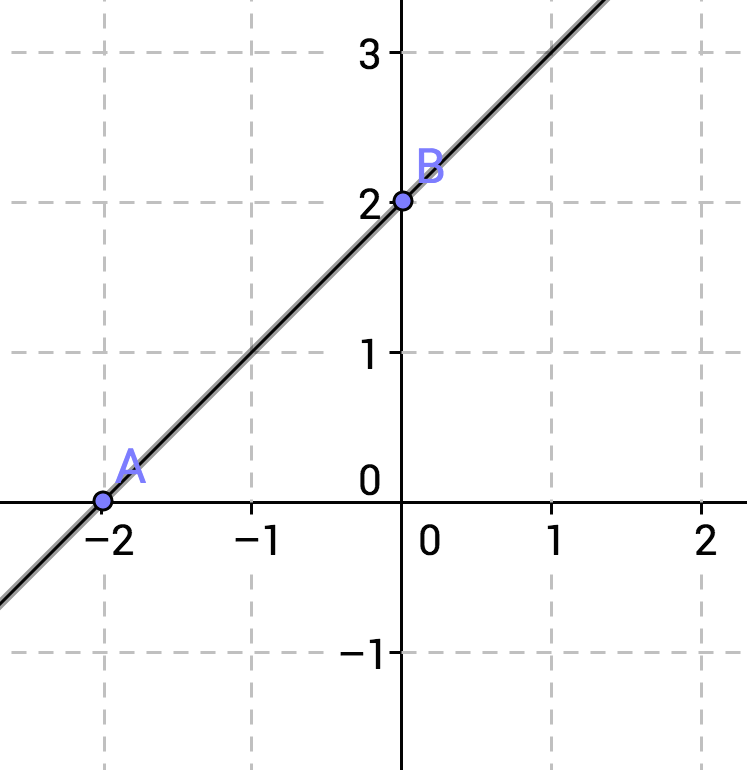
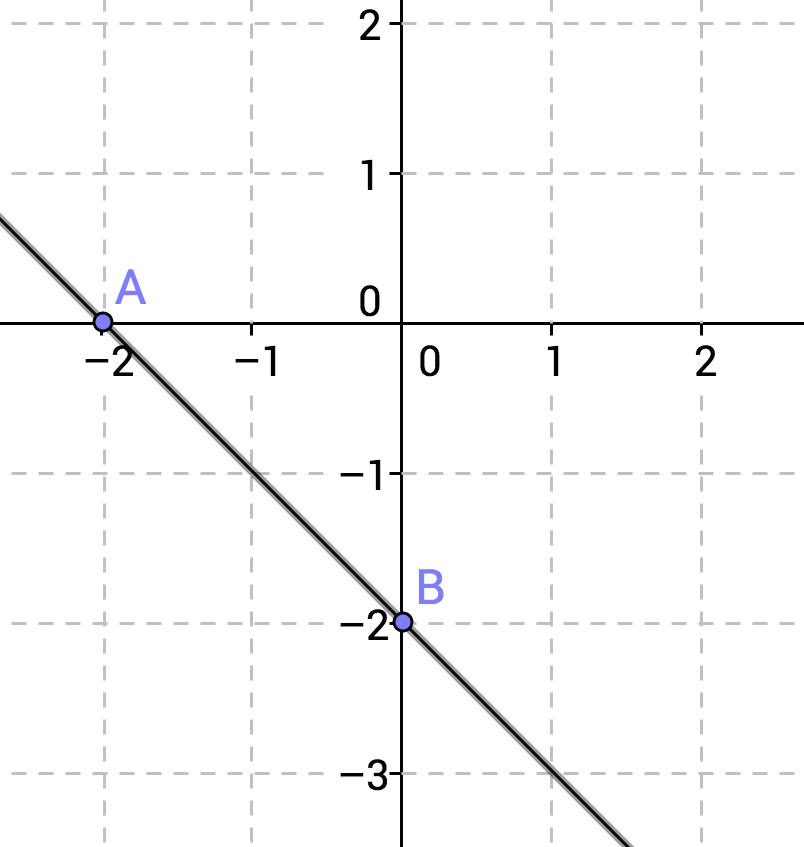
What is the equation for the line pictured above?


A line has the equation


The 
")

The slope can be found by selecting two points, for example, the y-intercept and the next point over that crosses an even point, for example, ")
Now applying the slope formula,

which yields 
Therefore the equation of the line becomes:

Example Question #2 : Graphing
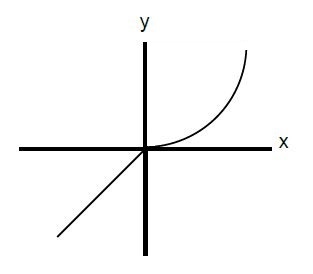
=2x+4")
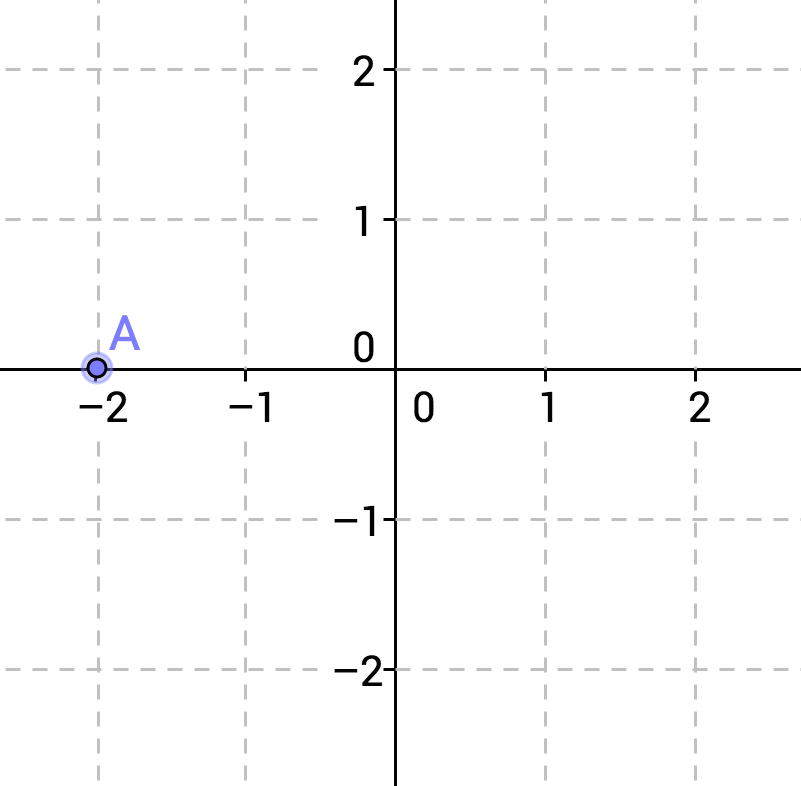
Which of the following graphs represents the y-intercept of this function?
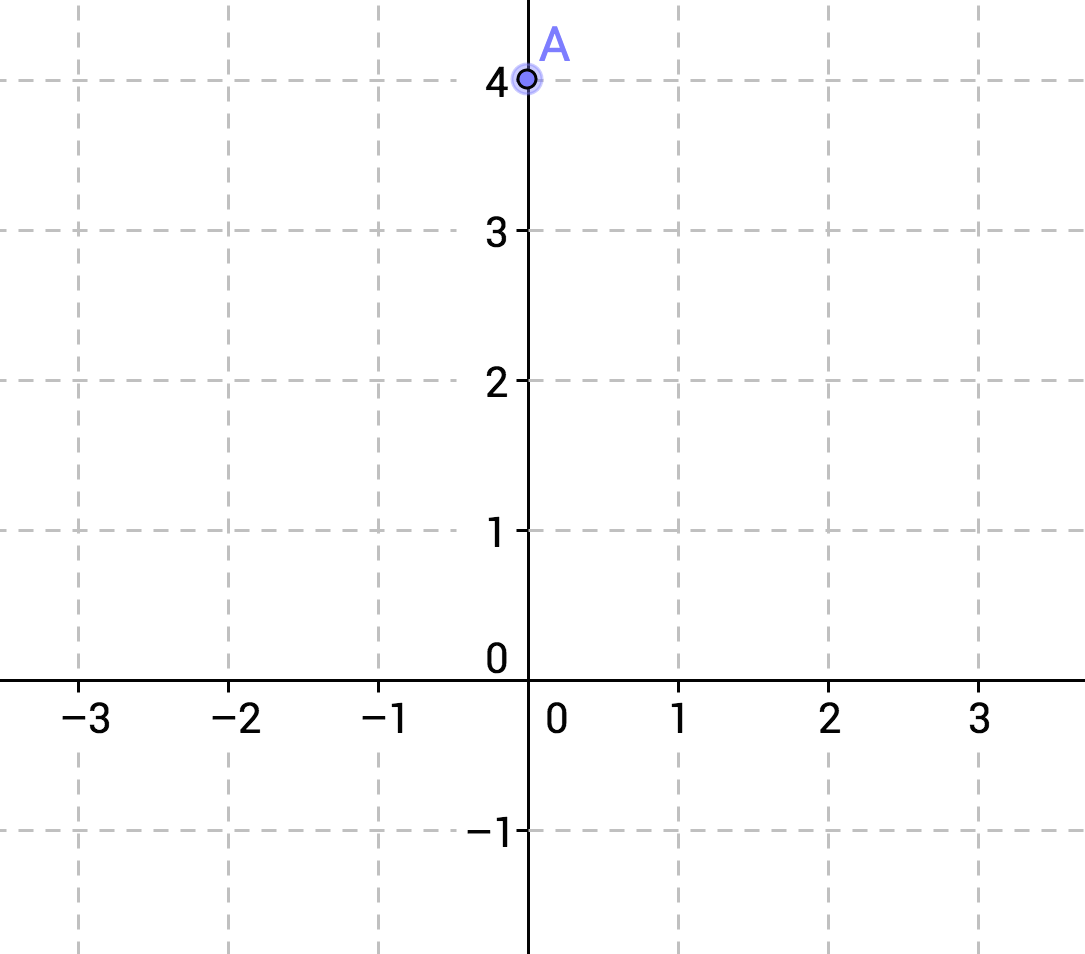
Graphically, the y-intercept is the point at which the graph touches the y-axis. Algebraically, it is the value of 

Here, we are given the function =2x+4")


+4")

So the y-intercept is at ")
Example Question #2 : Graphing
=2x+4")
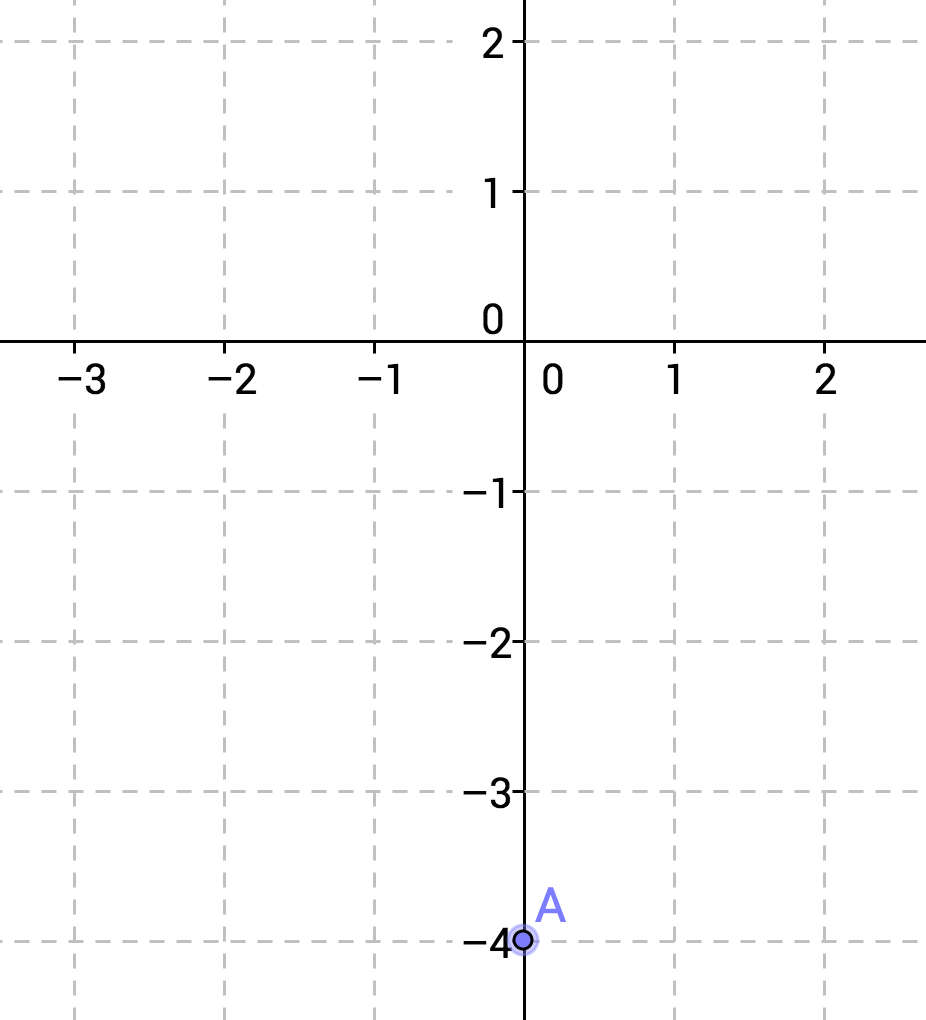
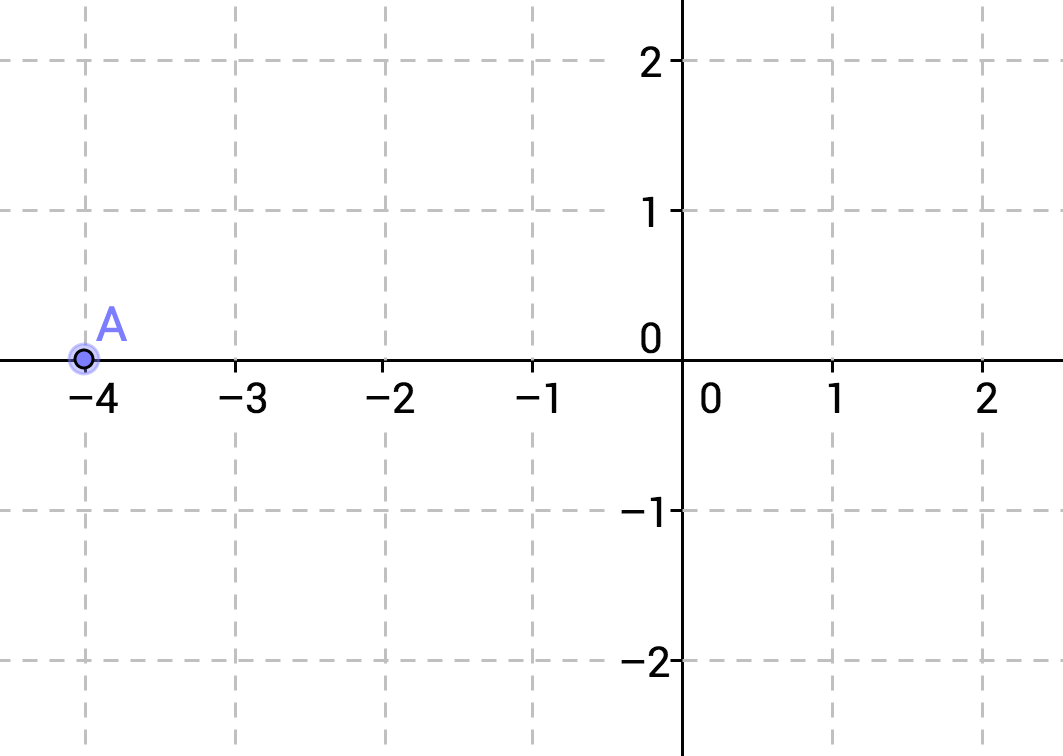
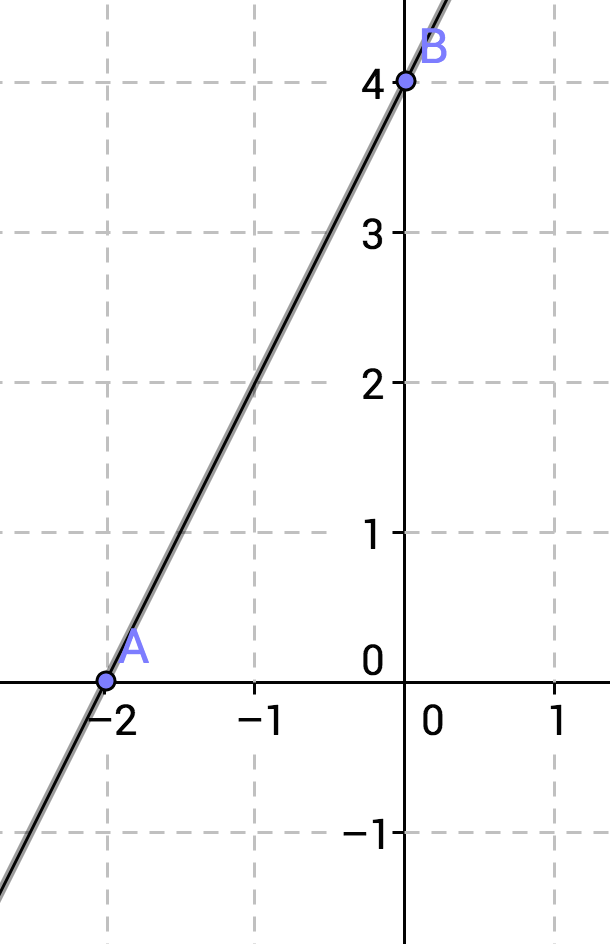
Which of the following graphs represents the x-intercept of this function?
Graphically, the x-intercept is the point at which the graph touches the x-axis. Algebraically, it is the value of 

Here, we are given the function =2x+4")


So the x-intercept is at ")
Example Question #11 : How To Graph A Function
Which of the following represents =\frac{1}{2}x-2")
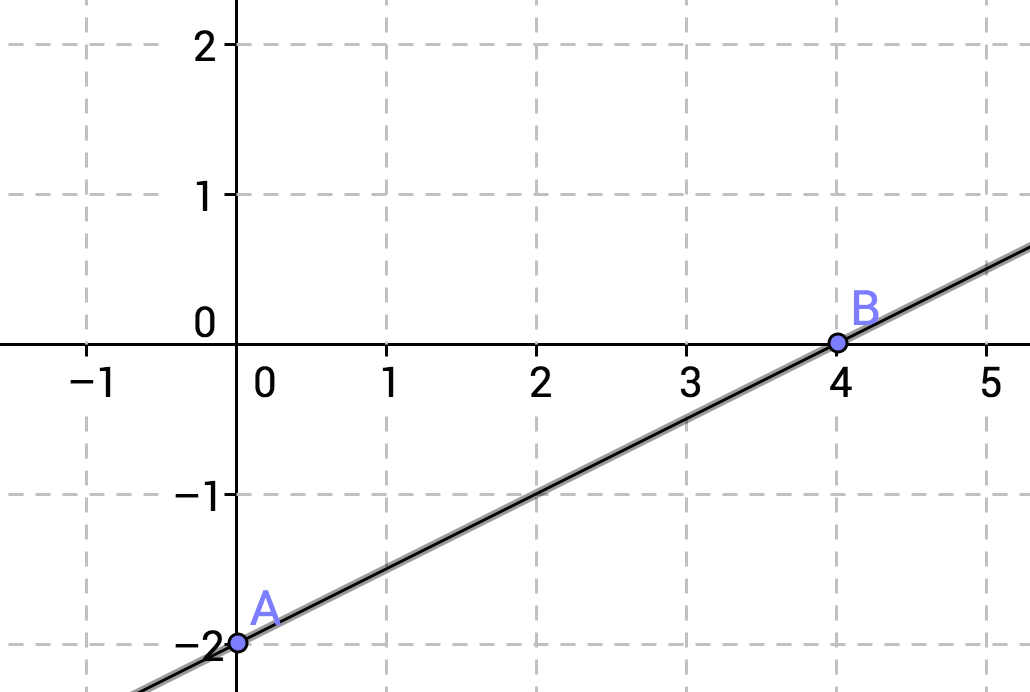
A line is defined by any two points on the line. It is frequently simplest to calculate two points by substituting zero for x and solving for y, and by substituting zero for y and solving for x.
=\frac{1}{2}x-2")
Let 
-2")

So our first set of points (which is also the y-intercept) is
")
Let 


So our second set of points (which is also the x-intercept) is )")
Example Question #1 : How To Graph A Function
The graphic shows Bob's walk. At what times is Bob the furthest from home?


If we look at the graph, the line segment from ")
")


Example Question #10 : Graphing
On the coordinate plane, a triangle has its vertices at the points with coordinates
")
")
")
")
")
")
")
")
The referenced figure is below.

The two non-horizontal line segments are perpendicular, as is proved as follows:
The slope of the line that connects ")
")


The slope of the line that connects ")
")


The product of their slopes is 
This makes the triangle right, and the side with endpoints ")
")
")


Certified Tutor

All SAT Math Resources

